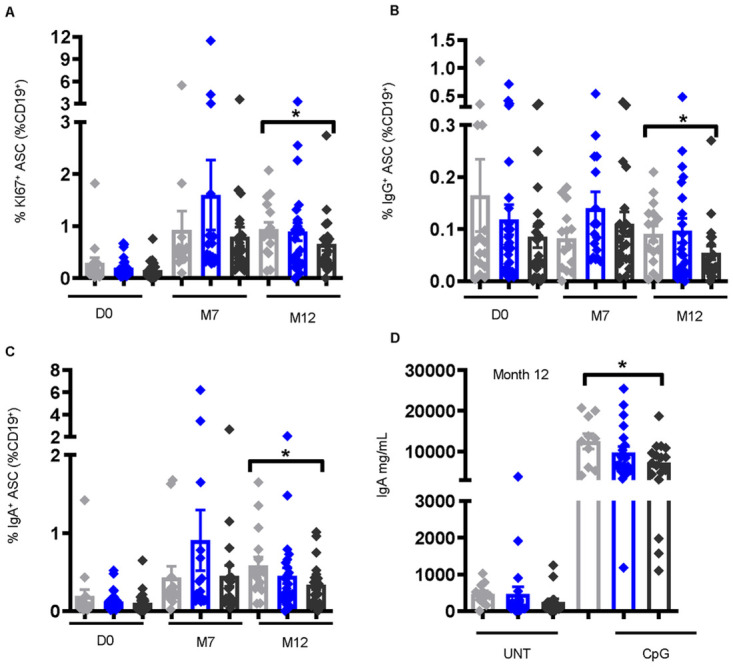
Fig 5. Frequencies of antibody secreting cells (ASCs) are lower at month 12 post-vaccination in individuals with high CAA concentration.

Frequencies of (A) KI67+ ASCs [CD19+CD10-IgD-CD71+CD38+CD20-], (B) IgG+ ASCs, and (C) IgA+ ASCs, identified by flow cytometry of PBMCs pre-vaccination (D0) [non-infected, n = 16, low CAA, n = 29, high CAA, n = 24], M7 post-vaccination [non-infected, n = 14, low CAA, n = 17, high CAA, n = 20], and M12 post-vaccination [non-infected, n = 16, low CAA, n = 23, high CAA, n = 21]. Data shown as ± SEM. * P ≤ 0.05. Wilcoxon rank-sum test performed on non-infected vs. low CAA, or non-infected vs. high CAA, or low CAA vs. high CAA for each time point separately D0, M7, or M12. (D) IgA levels at M12 post-vaccination in the culture supernatant of PBMCs stimulated for 7 days with CpG (CpG-ODN [TLR9]) or UNT (untreated) [D0 non-infected, n = 14, low CAA, n = 27, high CAA, n = 21; M12 post-vaccination non-infected, n = 10, low CAA, n = 20, and high CAA, n = 17]. Data shown as ± SEM. * P ≤ 0.05. Wilcoxon matched-pairs signed rank test performed on UNT vs. CpG for each non-infected, or low CAA, or high CAA, and within the CpG-treated group a Wilcoxon rank-sum test on non-infected vs. low CAA, or non-infected vs. high CAA, or low CAA vs. high CAA. Non-infected- light grey, low CAA—blue, and high CAA—dark grey.
