
FIGURE 1.
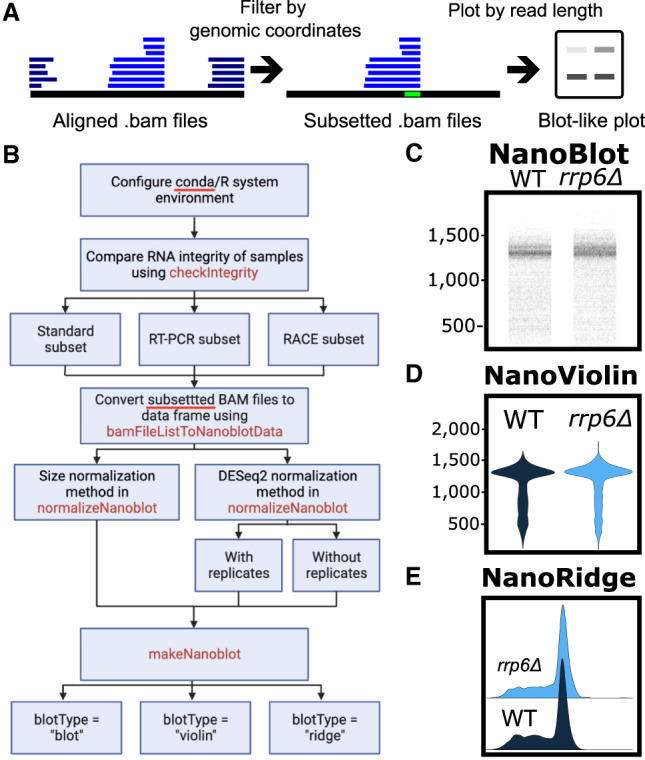
Overview of NanoBlot and example plots. (A) General overview of NanoBlot. NanoBlot's first step is the subsetting of BAM files based on a genomic region, shown in bright green. Reads are then represented as bands based on the length of the reads. Multiple samples and probes can be shown on the same plot. (B) Detailed workflow for using NanoBlot. (C–E) Example plots of the same data shown as a nanoblot (C), violin plot (D), and ridge plot (E).