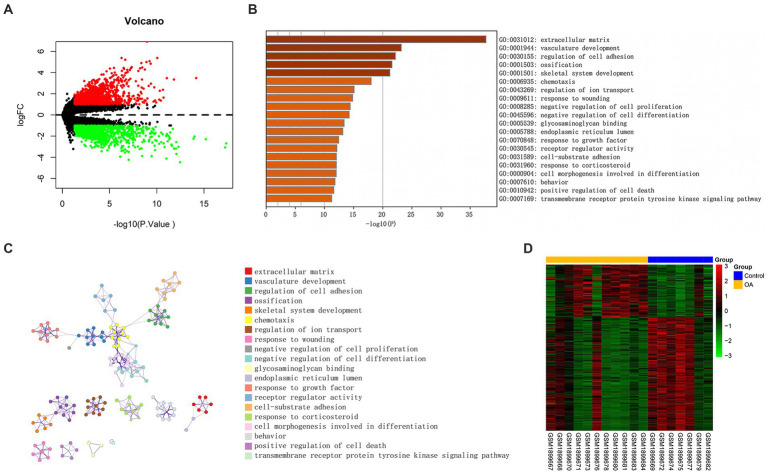
Figure 2.
Differentially expressed genes associated with OA. (A) Volcano plot of DEGs between OA and control (vioplot_0.3.7). (B) Significantly enriched paths. (C) Cluster network composed of enriched paths, where nodes sharing the same cluster are usually close to one another. (D) A heatmap of DMGs was built with data from GSE73626. The β value of one group was <0.2, but the other one was required to be >0.3, and p < 0.05.

