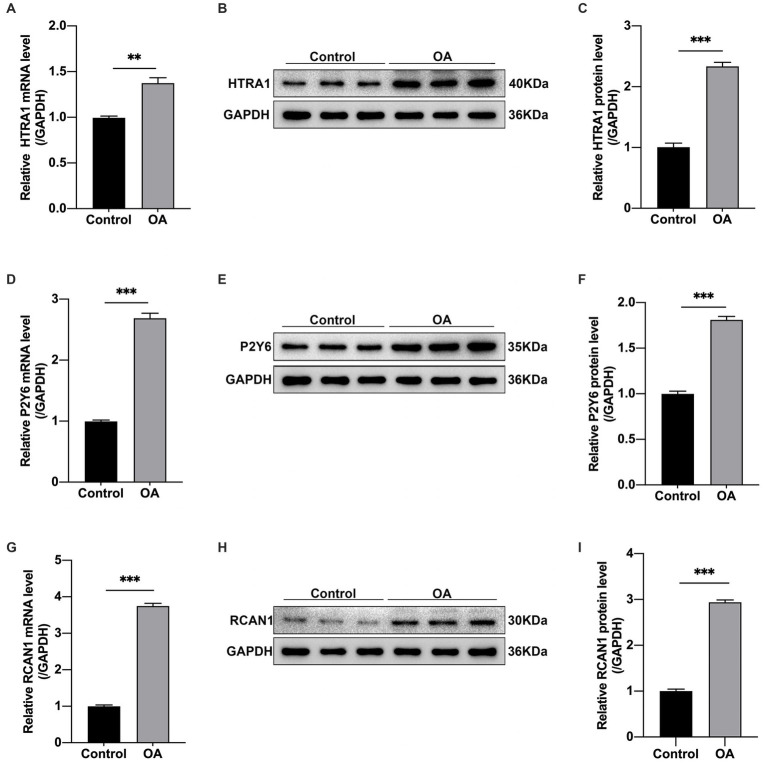
Figure 9.
By adopting RT-qPCR, the above 3 hub genes were discovered to be differentially expressed in the OA group in relative to the control group. (A) HTRA1, (D) P2RY6, and (G) RCAN1. GAPDH expression was taken as standard for all samples. Means ±SEM (n = 9) are used to represent values, *p < 0.05, **p < 0.01, ***p < 0.001 vs. control group, OA, osteoarthritis. (B,C,E,F,H,I) Quantitative analysis and Western blot assay exhibiting HTRA1, P2RY6, RCAN1 protein levels, and corresponding NCs, with GAPDH being the endogenous reference. In addition, data are indicated by means ±SEM, *p < 0.05, **p < 0.01, ***p < 0.001.

