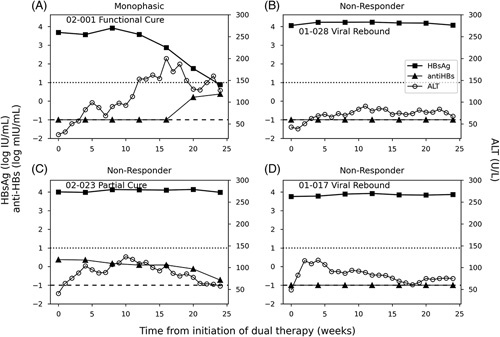
FIGURE 2.

Representative figures of HBsAg kinetics (and ALT flares) during dual therapy. (A) Participant 01-028 represents the 17 HBsAg nonresponders. (B) Participant 02-001 who was the only one who experienced HBsAg monophasic decline during dual therapy and achieved functional cure (HBV DNA not detected, HBsAg < lower level of quantification, and normal ALT after follow-up). Dotted and dashed horizontal lines represent the anti-HBs seroconversion threshold (10 mIU/mL) and anti-HBs target not detected (0.1 mIU/mL), respectively. (C) Participant 02-023 represents those HBsAg nonresponders who had partial cure (HBV DNA ≤ 2000 IU/mL, normal ALT) after triple therapy. (D) Participant 01-017 represents those HBsAg nonresponders who had virological rebound (HBV DNA >2000 IU/mL) after triple therapy. Abbreviations: ALT, alanine aminotransferase.
