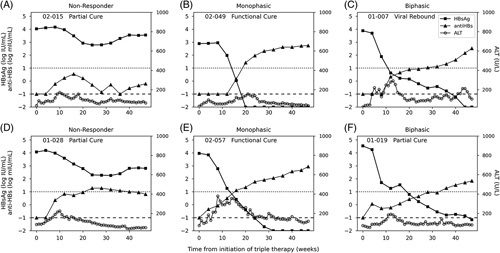
FIGURE 4.

Representative participants based on HBsAg response kinetic patterns during 48-week combination therapy with TDF, pegIFN, and NAPs. The participant-ID of each representative figure, along with the treatment outcome for that participant at the end of follow-up, is listed at the top left corner of each respective graph [functional cure (HBsAg<LLoQ, HBV DNA not detected and normal ALT), partial cure (HBV DNA≤2000 IU/mL, normal ALT), and VR = virological rebound (HBV DNA>2000 IU/mL)]. Participants of early triple therapy are shown in the top row and delayed triple therapy in the bottom row. The dotted horizontal line represents anti-HBs seroconversion (10 mIU/mL). The dashed horizontal line represents anti-HBs TND (0.1 mIU/mL). HBsAg seroconversion threshold or TND (0.01 IU/mL) is the lower boundary of the figure (ie, −2 log IU/mL. All 37 participants’ responses are available in Supplemental Figures S4 and S6 (http://links.lww.com/HC9/A365). Abbreviations: ALT, alanine aminotransferase; LLoQ, lower level of quantification; NAP, nucleic-acid polymer; pegIFN, pegylated interferon-α2a; TDF, tenofovir-disoproxil-fumarate; TND, target not detected.
