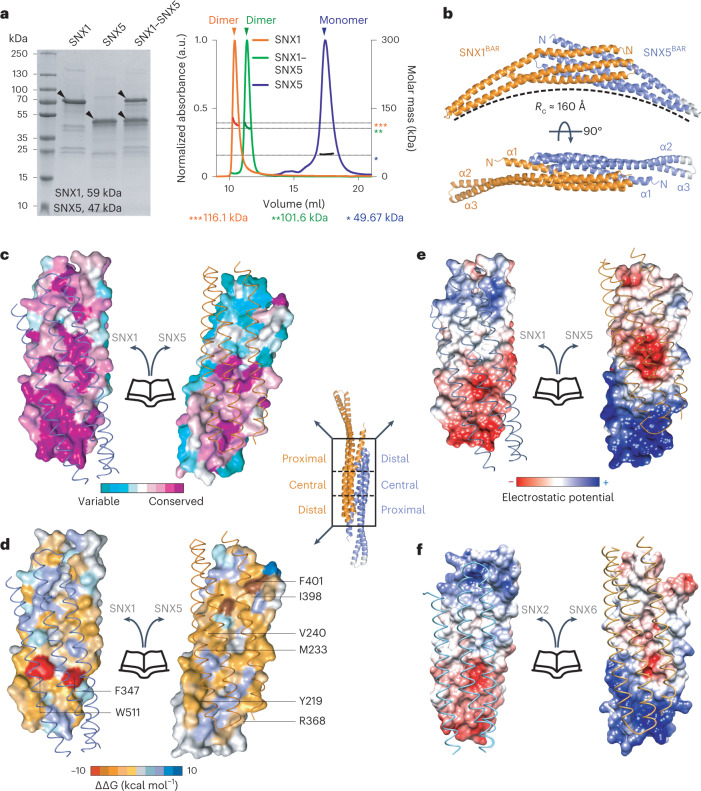
Fig. 1. Crystal structure of the SNX1BAR–SNX5BAR heterodimer and interface analysis.
a, SDS–PAGE and SEC–MALS analysis of full-length SNX1, SNX5 and SNX1–SNX5 showing the molecular weight difference between species. b, Structure of the human SNX1BAR–SNX5BAR heterodimer in two orthogonal views. Rc stands for radius of curvature. c–e, Close-up views of the SNX1BAR–SNX5BAR heterodimer interface illustrating conserved amino-acid residues (c), energetic landscape and binding hot-spot prediction (d) and electrostatic surface potential from −5 kT e−1 (red) to 5 kT e−1 (blue) (e). f, Electrostatic surface potential of the SNX2BAR–SNX6BAR heterodimerization interface generated by homology modeling. Results in a are representative of at least three independent experiments.

