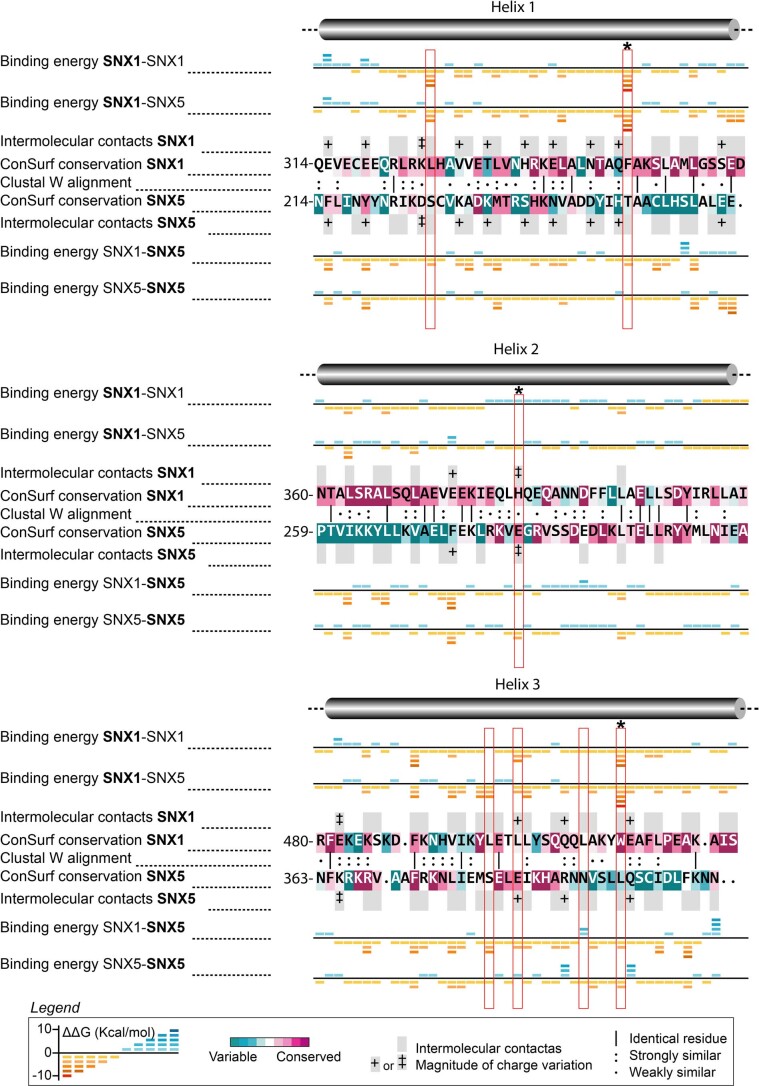
Extended Data Fig. 3. Pairwise comparison of interfaces.
Alignment generated from the structural superposition of SNX1BAR and SNX5BAR central regions. Alignments also include per-residue energetic contribution in theoretical SNX1 and SNX5 homodimers generated by homology modeling using our SNX1BAR-SNX5BAR crystal structure as template. Energetic values in each row correspond to the molecule highlighted in bold within the respective complex. Red boxes mark residues that were mutated to interfere with dimerization. Red boxes with an asterisk indicate residues that were mutated to promote SNX5 dimerization.

