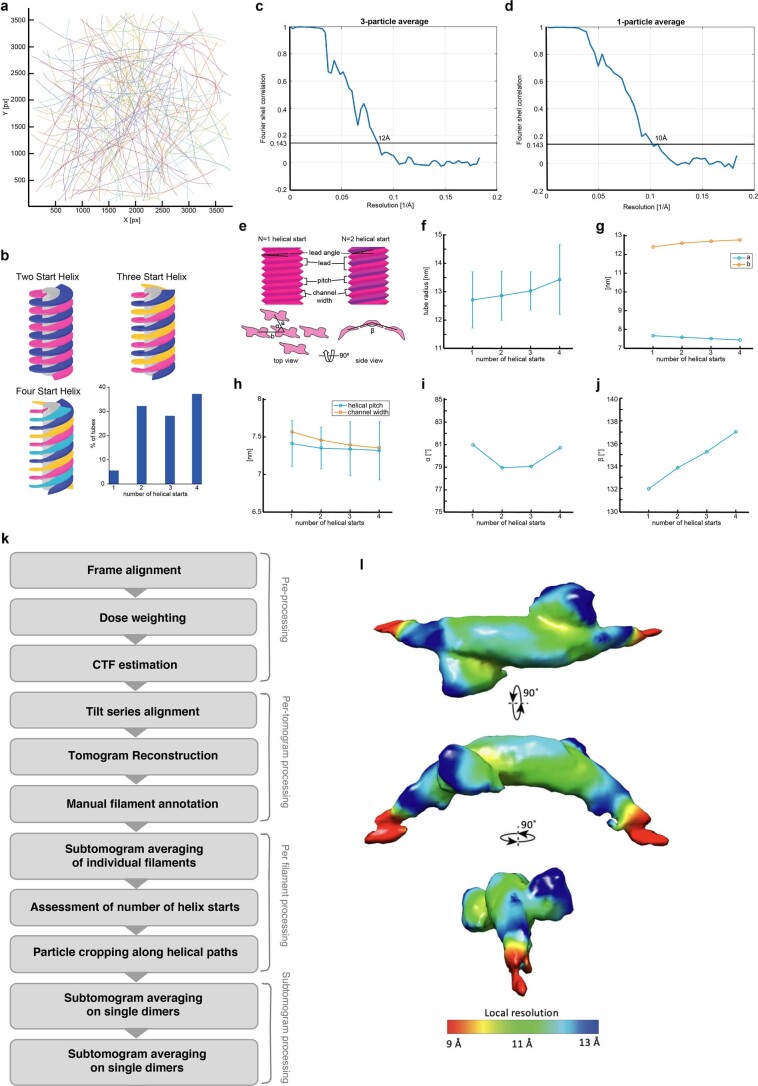
Extended Data Fig. 6. Lattice geometry and cryo-ET data processing workflow.
(a) Overlap of projections of coordinates from all selected tubes. No preferred orientation can be seen. (b) Distribution of number of helical starts of all analyzed tubes. (c) Fourier shell correlation (FSC) curve for the final 3-particle map. (d) Fourier shell correlation (FSC) curve for the final 1-particle map. (e) Definition of the analyzed helix parameters (pitch, lead, lead angle, channel width) and relations to neighboring particles (a, b, alpha, beta). (f) Tube radius (mean +/− SD) related to number of helical starts N. Mean and standard deviation have been computed on the available number of filaments detected for each N: 10 filaments for N = 1, 57 filaments for N = 2, 49 filaments for N = 3 and 65 filaments for N = 4. (g) Distances between the centers of the particles related to N. (h) Helical pitch and channel width related to N. Helical pitch is presented as mean values +/− SD. (i) Angle alpha related to N. (j) Angle beta related to N. (k) Cryo-ET data processing workflow. (l) Average of subtomograms from individual particles displaying local resolution (Å) coloured from highest resolution (red) to lowest resolution (dark blue).

