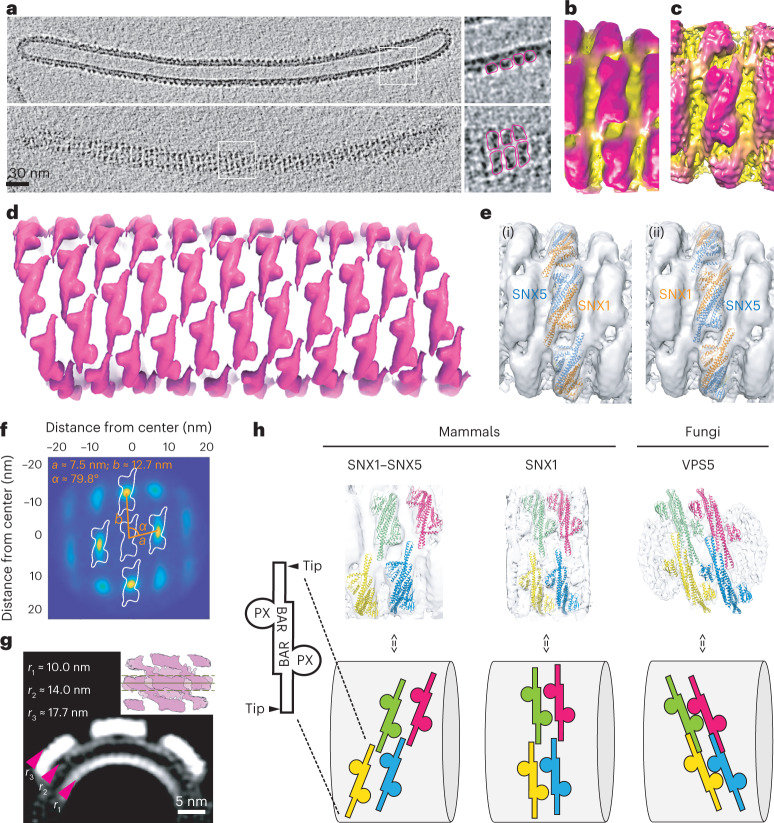
Fig. 3. Cryo-ET structure of the membrane-associated ESCPE-1 complex.
a, Sections from a tomogram of a representative tube showing a cut of the tube and its surface. Top and side views are highlighted. b, Final average of subtomograms that include three particles. c, Average of subtomograms from individual particles. d, One-particle averages placed at corresponding coordinates on a representative tube. e, Two possible orientations of the SNX1–SNX5 heterodimer are shown relative to the helical filament. f, Projection of neighborhood plot using all particles. The distances and angles were computed in 3D (using k-means clustering). g, Cross-section (averaged over 15 pixels) through the center of the three-heterodimer map from all particles. Arrowheads denote the radius of curvature for each leaflet of the membrane and the protein coat. The inset shows where the cross-section average was made. h, Comparison of membrane lattice scaffolds of the mammalian SNX1–SNX5 heterodimer (current study), the mammalian SNX1 dimer24 and the fungal VPS5 dimer solved in the context of the retromer complex23. Upper row shows four dimers in different colors at equivalent positions on each lattice. Lower row shows a cartoon representation for each lattice.

