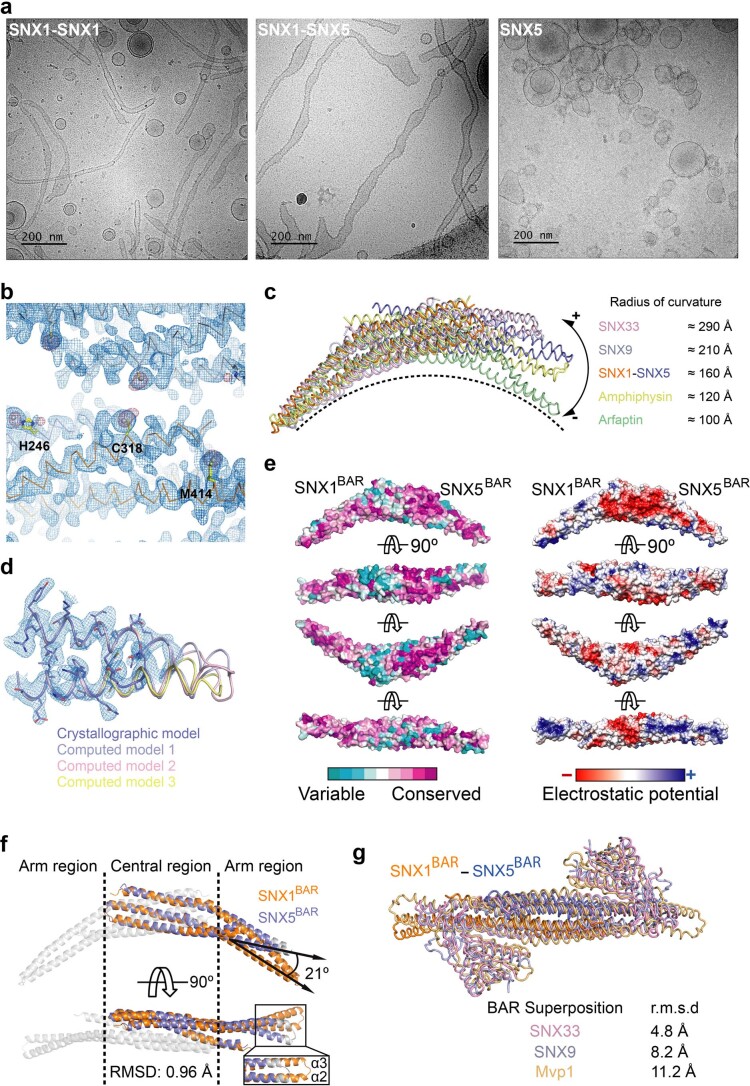
Extended Data Fig. 1. Structural comparison of BAR domains and PX-BAR proteins.
(a) Liposome tubulation ability. Representative cryo-TEM images of liposomes prepared with a defined lipid composition of DOPC/DOPE/DOPS/PtdIns(3)P (45:30:20:5 molar ratio) and incubated with SNX1 homodimers, SNX1-SNX5 heterodimer or monomeric SNX5. (b) MAD density map (blue) contoured at 1.5σ and Pt anomalous difference map (magenta) contoured at 4.0σ superimposed on the refined structure. Sidechains of H246, C318 and M414 are highlighted in yellow as examples of platinum binders. (c) Comparison of the curvature of SNX1BAR-SNX5BAR heterodimer with other BAR domains. To evidence differences in curvature, the structures were compared by superimposing SNX1BAR with one subunit from each dimer. (d) 2Fo-Fc electron density map (contour 1.0 σ) at the tip of the SNX5BAR domain. The main chain is shown as a tube (slate color) and side chains are shown as sticks. Predicted structures by the DaReUS-Loop web server are superimposed over the crystal structure. Model 1 represents the structure with the lowest statistical potential as determined by KORP61. (e) Left side ConSurf analysis62 showing surface conservation of amino-acid residues within the heterodimeric SNX1BAR-SNX5BAR. Right side illustrates electrostatic surface potential viewed in the same orientations as in the left side. The scale ranges from −5 kT e-1 (red) to 5 kT e-1 (blue). (f) SNX1BAR superposed with SNX5BAR through the central region highlighting the structural variations between the distal arms. (g) Superposition of known PX-BAR structures (SNX33, PDB 4AKV [to be published]; SNX9, PDB 2RAI63; Mvp1, PDB 6Q0X64 over the SNX1BAR-SNX5BAR heterodimer. Data in a are representative of three independent experiments.

