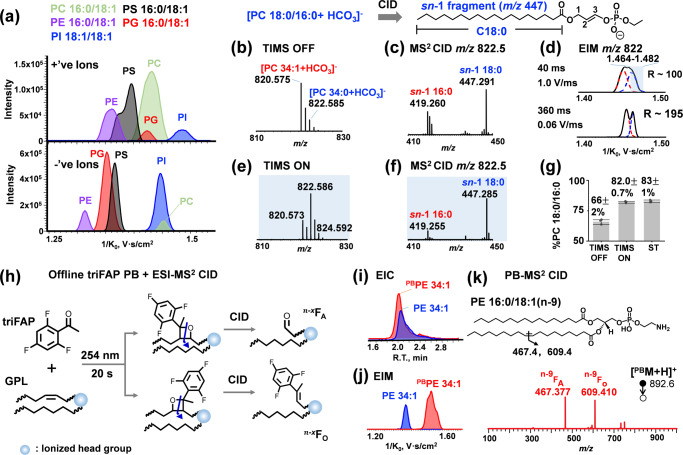
Fig. 1. HILIC-TIMS-MS/MS system for detailed structural analysis of GPLs.
a Extracted ion mobilograms (EIMs) of five GPL standards detected in positive ion mode ([M + H]+ for PC, PE, and PS, [M + NH4]+ for PG and PI, upper panel) and negative ion mode ([M–H]− for PG, PI, PS, and PE, [M + HCO3]− for PC, lower panel). b Negative ion mode MS1 spectrum of a 10:1 mixture of PC 16:0/18:1 and PC 18:0/16:0, detected as [M + HCO3]−. c Zoomed-in MS2 CID spectrum of m/z 822.59 formed in panel b without TIMS separation. Only the m/z region of sn-1 fragment is shown. Inset shows the structure of the sn-1 18:0 fragment (m/z 447) derived from MS2 CID of PC 18:0/16:0 ([M + HCO3]−). d EIMs of m/z 822.585 (black trace) formed in panel b with a scan rate of 1 V/ms and 0.06 V/ms during TIMS separation. The +2 Da isotope of PC 16:0/18:1 and the mono-isotope of PC 18:0/16:0 are gaussian deconvoluted and shaded in red and blue, respectively. Resolving power (R) is listed. Mobility-resolved (e) MS1 spectrum and (f) MS/MS spectrum of m/z 822.59 isolated from 1/K0 of 1.464–1.482 V•s/cm2 in panel d. g Comparison of the purity of PC 18:0/16:0 without and with TIMS separation (N = 3 independent experiments). Bars represent mean values ± standard deviation (SD). (h) Schematic presentation of triFAP PB-MS2 CID for generating C = C diagnostic ions. (i) Extracted ion chromatograms (EICs) of unreacted PE 16:0/18:1(n-9) (blue trace) and triFAP-modified PE 16:0/18:1(n-9) (red trace). j EIMs of unreacted PE 16:0/18:1(n-9) (blue trace) and triFAP-modified PE 16:0/18:1 (n-9) (red trace). k MS2 CID spectrum of triFAP-derivatized PE 16:0/18:1(n-9) ([PBM + H] +, m/z 892.6). Source data are provided as a Source Data file.

