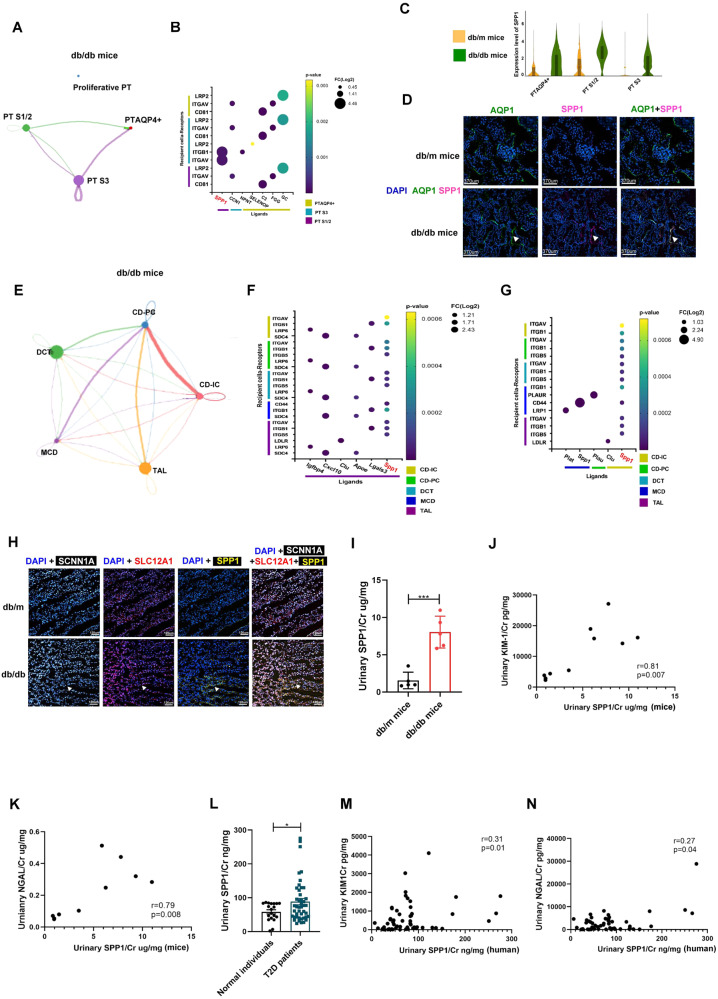
Fig. 5. SPP1 modulates the communication within PT subtypes and distal tubules in early DKD.
A, B The interaction among four PT subtypes in db/db mice. C Violin plot of SPP1 among PT subtype between db/m and db/db mice. D The kidneys of db/m mice and db/db mice were collected and staining by CODEX Multiplexed Tissue Staining. PT (AQP1, green), SPP1 (pink), and DAPI (blue). Scale bars, 370 μm. ▲ (double stain of SPP1 and AQP1). E The interaction among TAL, DCT, CD-IC, CD-PC and MCD in db/db mice. F The communication between TAL and other five types of kidney tubules in db/db mice. G The communication of MCD, CD-IC and CD-PC with other five types of kidney tubules in db/db mice. H The kidneys of db/m mice and db/db mice were collected and staining by CODEX multiplexed tissue staining. TAL (SLC12A1, red), CD-IC (SCNN1A, white), SPP1 yellow), and DAPI (blue) were indicated by the white arrow. Scale bars, 120 μm. ▲ (Triple stain of SPP1, SCNN1A, and SLC12A1). I Urinary SPP1/Cr levels in db/m (n = 6) and db/db mice (n = 6). J, K The relationship between urinary SPP1 and Kim-1/Cr and NGAL/Cr in mice. L Urinary SPP1/Cr levels in 24 normal individuals and 48 T2D patients. M, N The relationship between urinary SPP1 and Kim-1/Cr and NGAL/Cr in human. The level of SPP1, NGAL and Kim-1 in the urine measured using ELISA. Levels Cr assessed using the enzymatic method. J The level of SPP1 in the urine measured using ELISA. The bar graph represents the mean ± S.E.M. *p < 0.05, **p < 0.01, ***p < 0.001 by Student’s t test, and p-value of correlation was analyzed by Spearman analysis.

