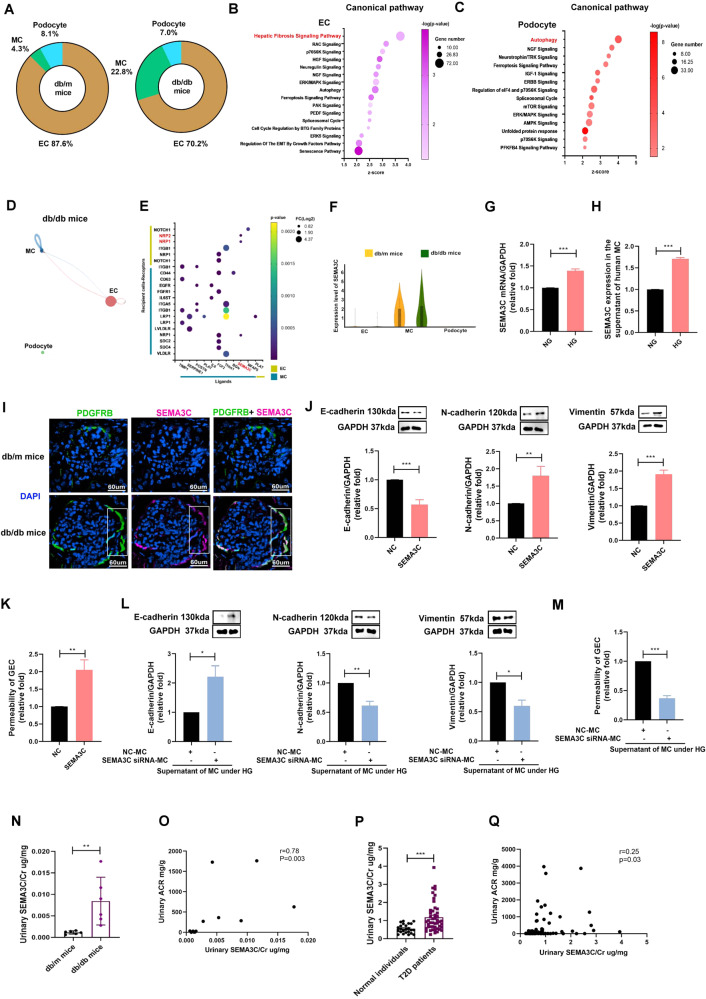
Fig. 6. MC-secreted SEMA3C regulated the cross-talk of glomerulus microenvironment of early DKD.
A The percentage of glomerular cells. B, C Canonical pathway of the gene of EC and podocyte of db/db mice compared to db/m mice. D, E The interaction within glomerulus in db/db mice. F Violin plot of SEMA3C in MC, EC and podocyte of db/m and db/db mice. G mRNA expression of SEMA3C in MC treated with NG and HG for 48 h measured by qRT-PCR (n = 3). H SEMA3C protein expression in the supernatant of MC treated with NG (5.5 mM) and HG (25 mM) for 48 h measured by ELISA. I The kidneys of db/m mice and db/db mice were collected and staining by CODEX Multiplexed Tissue Staining. MC (PDGFRB, green), SEMA3C (pink), and DAPI (blue). Scale bars, 60 μm. J E-cadherin, N-cadherin and vimentin expression in GECs treated with SEMA3C (10 ng/ml) for 48 h using western blotting (n = 3). K Permeability of GECs treated with SEMC3C (10 ng/ml) for 48 h using transendothelial permeability assay (n = 3). L MC was transfected with SEMA3C siRNA (20 nM) or NC (20 nM) for 24 h, and then treated under HG condition for 48 h. GEC was cultured with the supernatant of HG-treated MC for 48 h. E-cadherin, N-cadherin and vimentin expression in cultured GECs using western blotting (n = 3). M Permeability of cultured GECs using transendothelial permeability assay (n = 3). N Urinary SEMA3C/Cr levels in db/m (n = 6) and db/db mice (n = 6). O The relationship between urinary SEMA3C/Cr levels and urinary ACR in mice. P Urinary SEMA3C/Cr levels in 24 normal individuals and 48 T2D patients. Q The relationship between urinary SEMA3C/Cr levels and urinary ACR in human. The level of SEMA3C in the urine measured using ELISA. Urine albumin was measured using the immunoturbidimetric assay. Levels Cr assessed using the enzymatic method. The bar graph represents the mean ± S.E.M. *p < 0.05, **p < 0.01, ***p < 0.001 by Student’s t test or ANOVA followed by the post hoc test with Tukey’s correction, and p-value of correlation was analyzed by Spearman analysis.

