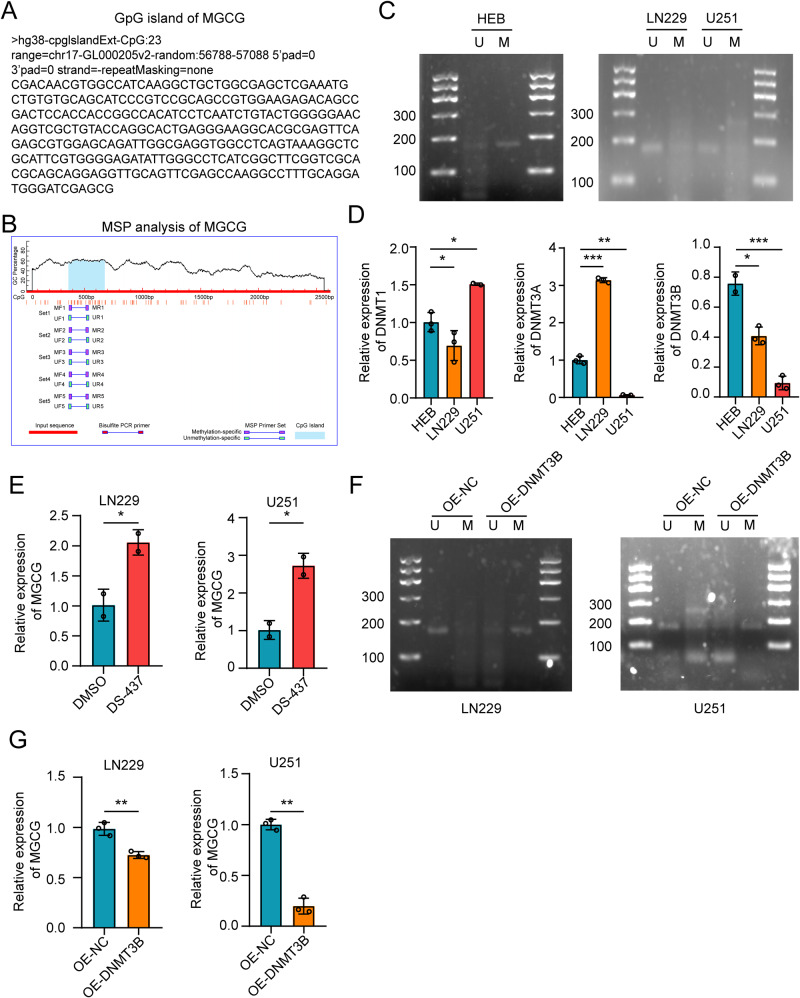
Fig. 5. DNA methyltransferase 3B inhibits the expression of MGCG in GBM.
A The UCSC Genome Bioinformatics Site was used to identify the CpG islands in MGCG. B Schematic representation of the CpG islands. The red region indicates the input sequence; the blue region indicates the CpG islands. C MSP analysis was performed to examine the methylation status of a CpG island in MGCG in HEB, LN229, and U251 cells. D The data of RT‒qPCR show the expression of DNMTs in HEB, LN229, and U251 cells. (DNMTs: DNMT1, DNMT3A, and DNMT3B). E RT‒qPCR assay of MGCG expression in LN229 and U251 cells after the treatment with DMSO or DS-437 for 72 h. F MSP analysis of CpG (MGCG) after overexpressing DNMT3B. G RT‒qPCR analysis of MGCG expression after overexpressing DNMT3B. Error bars, SEM from three independent experiments. *P < 0.05; **P < 0.01; ***P < 0.001 by two-tailed Student’s test.

