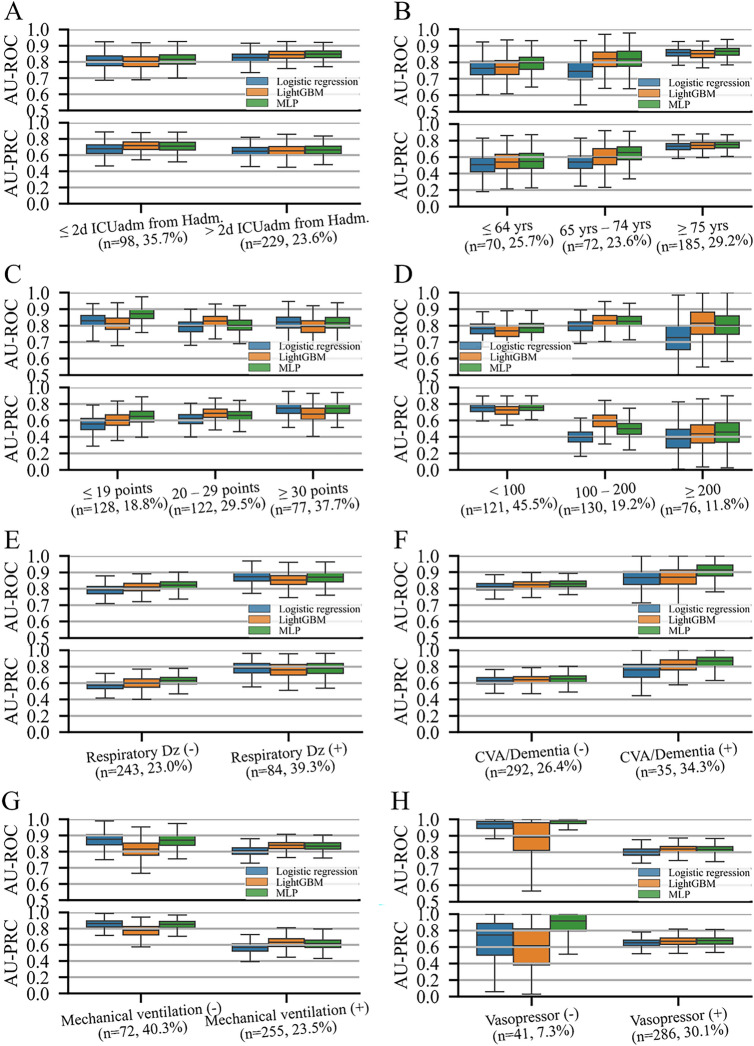
Figure 3.
Overall performance by subgroup. The area under the receiver operating characteristic curves and precision-recall curves. The notation (n = a, b%) under each subgroup name indicates (A) the number of samples in the test set and (B) the prevalence rate of the outcome of the subgroup. Box plots are plotted with whiskers of 1.5 times the interquartile ranges. The subgrouping variables are (A) the period from hospital admission to ICU admission, (B) age, (C) Acute Physiology and Chronic Health Evaluation (APACH) II scores, (D) PaO2/FiO2 ratio, (E) history of chronic respiratory disease, (F) history of cerebrovascular accident or dementia, (G) mechanical ventilation, and (H) vasopressor use. AU-PRC, area under the precision-recall curve; AU-ROC, area under the receiver operating characteristics curve; CVA, cerebrovascular accident; Dz, disease; Hadm, hospital admission; ICU admission; yrs, years.

