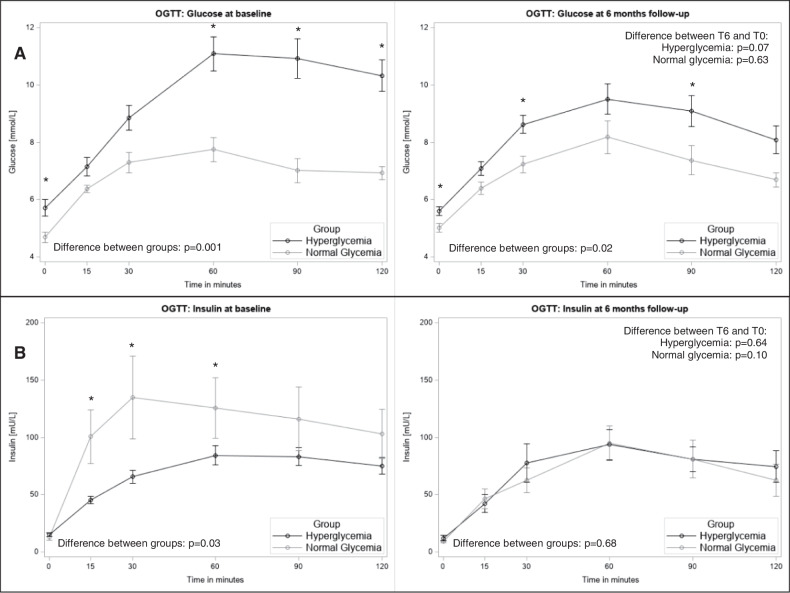
Fig. 1. Oral glucose tolerance test (OGTT) curves for glucose and insulin in the analysis population with complete outcome data (n = 26).
Group differences between the normal glycaemic (gray) and hyperglycaemic (black) groups were tested with unpaired T-test for the single time points of the OGTT curves and differences between T6 and T0 with repeated measures ANOVA. Data are shown for A glucose and B insulin at baseline and at 6 months follow-up, respectively, *p < 0.05 indicating group differences at single time points. OGTT, oral glucose tolerance test; T0, baseline visit; T6, visit after six months.

