
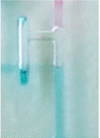
Table 2.
Steps of the loading and activation processes of the π-valve
| Process Step | Simulation | Experimental Image | Pressure Contour |
|---|---|---|---|
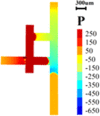
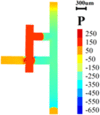
| Loading – The first liquid (blue) was loaded from the inlet channel until the stop junction before entering to the void area. The second liquid (red) passed through the activation resistance component in the main channel. | 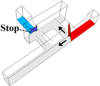 |
 |
 |
| Air Trap – As soon as the second liquid (red) filled the deep and shallow branches, the air trapped in the void isolated the blue and red liquids. |  |
 |
 |
| Equilibration – The capillary action from the shallow branch increased the pressure within the void. To equilibrate this pneumatic pressure, the liquid (red) in the deep branch was pushed slightly back to the main channel. | 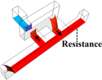 |
 |
 |
| Activation – The first liquid (blue) was active when the second liquid (red) emptied up to the activation resistance in the main channel. Since the activation resistance was strong, the capillary pressure in the downstream could not empty the liquid from the main channel, providing the required suction power to the deep branch. Subsequently, the air trapped in the void was displaced by the pneumatic suction, which introduced the blue liquid into the void. |  |
 |
 |
| Release – As a result, the air displacement connected the blue liquid with the red liquid. The blue liquid was released spontaneously to the main channel through the shallow branch. |  |
 |
 |
The simulation pictures were taken from Supplementary Information Video 1, showing the phase contour between the air–liquid phases. The experimental pictures are screenshots from Supplementary Information Video 2, showing the autonomous release of blue liquid triggered by red liquid. Pressure contour pictures were collected from the computational fluid dynamics calculations that were determined by following the governing equation mentioned in SI 1