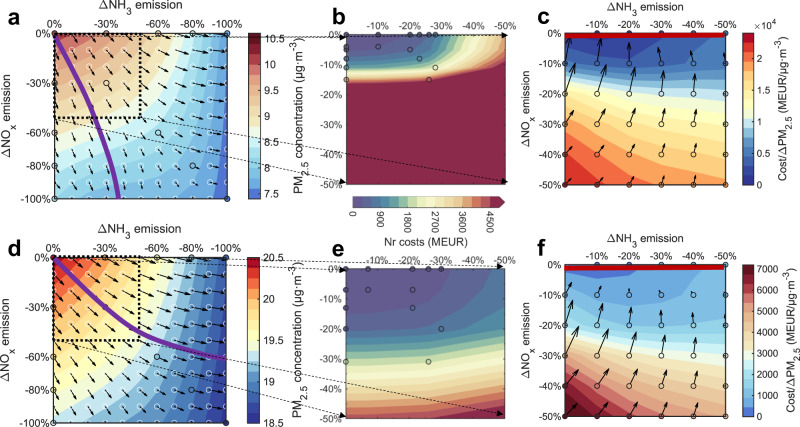
Fig. 5. Diagnostic diagram to identify the optimal pathway of reactive nitrogen (Nr) emission controls towards effective PM2.5 abatement and minimal control costs.
a, d the diagnostic diagram for effectiveness of regional annual mean PM2.5 abatement to find the optimal pathway (purple line) of Nr emission controls in Western Europe (a) and Eastern Europe (d). b, e Control costs for Nr emissions according to the NH3 (x-axis) and NOx (y-axis) emission changes from 0 to 50% in Western Europe (b) and Eastern Europe (e). c, f the diagnostic diagram for the ratio of control costs and PM2.5 abatement to find the optimal pathway (red line) of Nr emission controls in Western Europe (c) and Eastern Europe (f). Black, white circles, and black arrows in (a) and (d) show 13 sets of simulated regional mean PM2.5 concentrations, interpolated PM2.5 concentrations, and their gradients in the diagnostic diagram. Black circles in (b) and (e) show control costs from five sets of feasible scenarios in the GAINS model. Black circles and arrows in (c) and (f) show the ratio of control costs and PM2.5 abatement at each 10% control level and their gradients in the diagnostic diagram.

