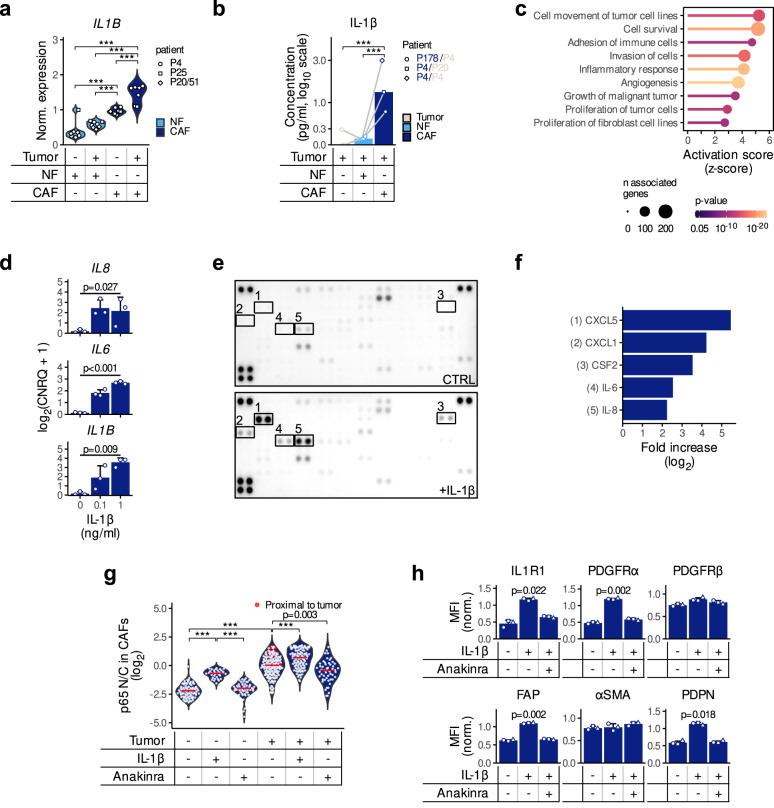
Fig. 3. Activation of the IL1-pathway in CAFs by tumor cells leads to an elevated secretion of pro-inflammatory cytokines.
a IL1B expression in fibroblasts upon co-culture with tumor cells quantified by qPCR. NF/CAF and tumor spheroid cultures were either paired (P4 and P25) or unpaired (P51 tumor and P20 NF/CAF). CNRQ expression values have been normalized by log2 transformation followed by a non-centered scaling by patient pairs shapes (Tukey post-hoc test following a nested ANOVA design; ***p < 0.001). b IL-1β concentrations (pg/ml) in the media from tumor cells cultured alone or in the presence of NFs or CAFs. n = 3 independent experiments (connecting lines) from paired cultures (P4) or unpaired cultures (P178 tumor spheres and P4 NF/CAF) are shown (Tukey post-hoc test following a repeated measures ANOVA; ***p < 0.001). c Predicted activation of downstream cellular effects in CAFs upon IL1β stimulation. Differentially expressed genes were analyzed using the Ingenuity Pathway Analysis (IPA) software with the “Downstream Effects Analysis” function. d Expression of IL8, IL6, and IL1B after IL-1β stimulation (100 pg/ml or 1 ng/ml) of P4 CAFs. Log2 transformed CNRQ expression values from n = 3 independent experiments are shown as mean ± SD (Repeated measures ANOVA). e, f Cytokine secretion triggered by IL-1β stimulation (1 ng/ml) in tumor fibroblasts (CT5.3 cells). The Proteome Profiler Human XL Cytokine Array Kit (R&D Systems) was used to identify cytokines secreted into the conditioned media (n = 2 independent experiments). Images in e were analyzed using ImageJ and the integrated densities in f were normalized to the values measured in the control condition (CTRL). g p65 nuclear-to-cytoplasmic ratio (N/C) in CAFs. After treating tumor cell (LS174T)—CAF (CAF-8) co-cultures with either IL-1β or Anakinra, ICC staining of p65 was quantified using ImageJ and N/C was calculated. Red dots show CAFs in close proximity to tumor spheroids (<25 µm). Tukey post-hoc test following a one-way ANOVA (***p < 0.001) (n = 2 independent experiments). h MFI of IL1R1, PDGFRα, PDGFRβ, FAP, αSMA and PDPN on IL-1β treated CT5.3 cells as assessed by flow cytometry. Values measured in n = 3 independent experiments were normalized (non-centered scaling) and bar charts represent the mean ± SD (Holm’s adjusted two-sided pairwise paired t-test). Source data are provided as a Source Data file.

