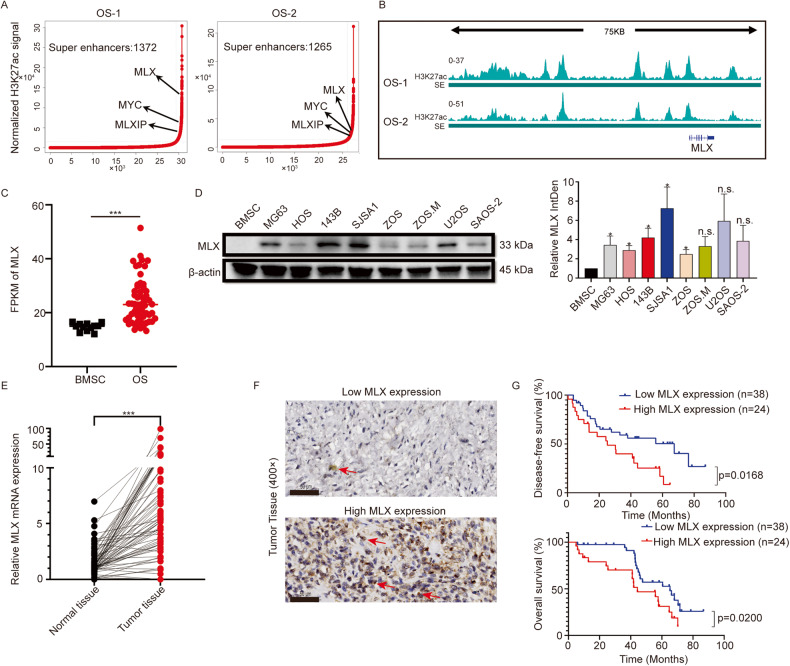
Fig. 1. Upregulation of SE-driven MLX in osteosarcoma is correlated with poor prognosis.
A Stitched enhancers ranked by H3K27ac ChIP-seq signal in two clinical samples. B The H3K27ac signal near the upstream super-enhancers of MLX locus. C Transcriptomic sequencing results showing the expression of MLX in OS and BMSC from publicly available datasets [33–35]. Data are represented as mean ± SD, BMSC, n = 12; OS, n = 60. Unpaired t-test was used. D Western blot analysis of MLX in various OS cell lines and BMSC. Data are represented as mean ± SD, n = 3. Unpaired t-test was used. E RT-qPCR analysis of relative MLX expression in osteosarcoma tissues and adjacent normal tissues. Data are represented as mean ± SD, n = 72. Paired t-test was used. ***: P ≤ 0.001, **: P ≤ 0.01, *: P ≤ 0.05, n.s.: not significant. F Representative IHC staining of OS tissues with low- or high-MLX (scale bar = 50 μm). G Kaplan–Meier analysis of overall and disease-free survival for osteosarcoma patients with high- or low-MLX expression.

