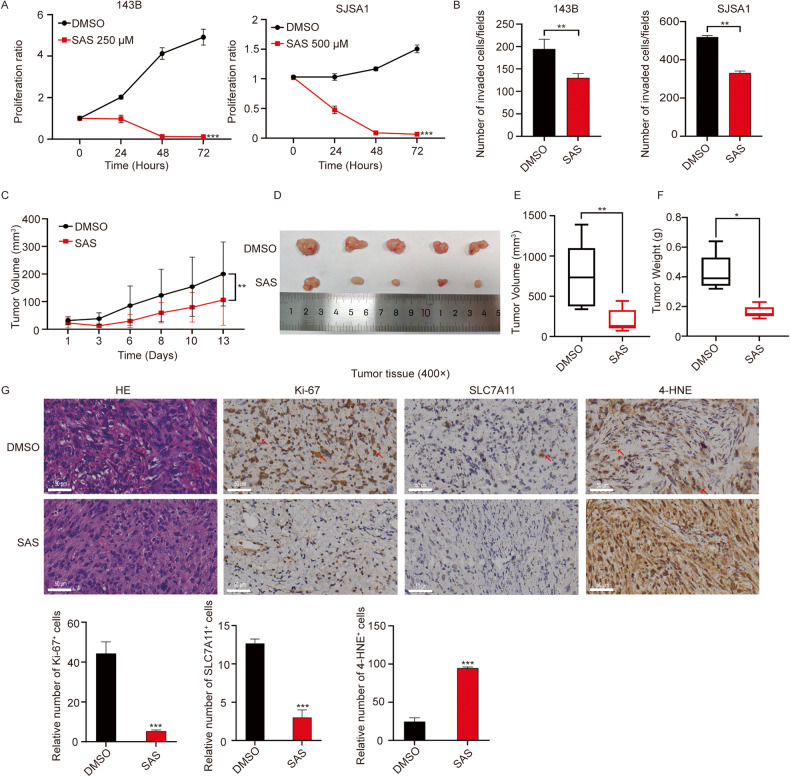
Fig. 6. Sulfasalazine effectively suppresses the growth and metastasis of osteosarcoma in vitro and in vivo.
A Relative growth curves of 143B (left) and SJSA1(right) cells treated with sulfasalazine (SAS) or DMSO. Data are represented as mean ± SD, n = 3. Paired t-test was used. B Analysis of cell invasion in 143B (left) and SJSA1 (right) upon treatment of SAS or DMSO. Data are represented as mean ± SD, n = 3. Unpaired t-test was used. C The PDX tumor growth curve upon treatment of SAS. Data are represented as mean ± SD, n = 5. Paired t-test was used. D–F Representative images of DMSO- or SAS-treated (100 mg/kg) PDX tissues on day 13 and the statistical analysis of PDX volume and weight. Data are represented as mean ± SD, n = 5. Unpaired t-test was used. G Representative images of H&E, Ki-67, SLC7A11 and 4-HNE staining of the PDX tissues and the respective statistical analysis (scale bar = 50 μm). Data are represented as mean ± SD, n = 3. Unpaired t-test was used. ***: P ≤ 0.001, **: P ≤ 0.01, *: P ≤ 0.05, n.s.: not significant.

