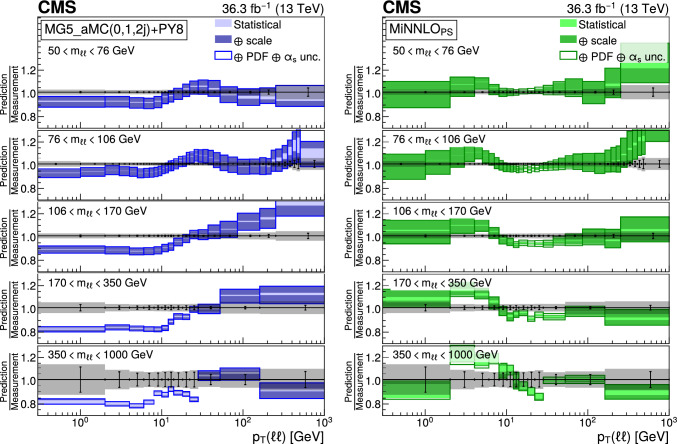
Fig. 6.
Comparison to Monte Carlo predictions based on a matrix element with parton shower merging. The ratio of mg5_amc (0, 1, and 2 jets at NLO) + pythia 8 (left) and (right) predictions to the measured differential cross sections in are presented for various ranges. The error bars correspond to the statistical uncertainty of the measurement and the shaded bands to the total experimental uncertainty. The light color band corresponds to the statistical uncertainty of the simulation and the dark color band includes the scale uncertainty. The largest bands include PDF and uncertainties, added in quadrature

