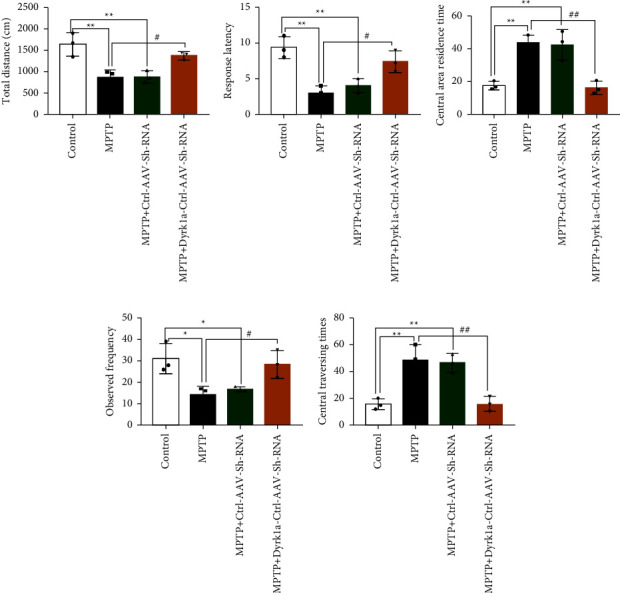
Figure 2.

Open field experimental test results: (a) total distance of movement; (b) first frame latency; (c) central area dwell time; (d) number of standing observations; and (e) number of central crossings. Experimental results are expressed as the mean ± standard error (X ± SD). ∗: P < 0.05, ∗∗: P < 0.01, ∗∗∗: P < 0.001 vs. the control group. #: P < 0.05, ##: P < 0.01, and ###: P < 0.001 vs. the MPTP group.
