
Figure 3.
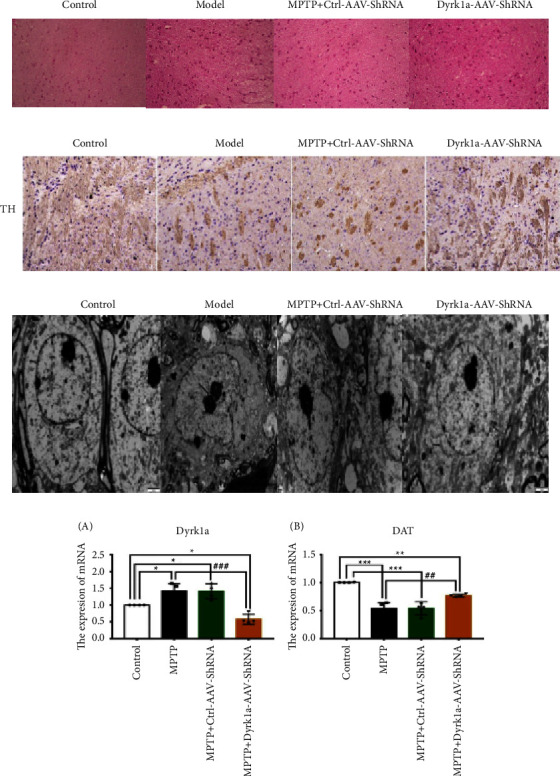
(a): HE staining of the brain tissue of mice in each group (×200); (b) immunohistochemical staining; (c) ultrastructural alterations in the nigrostriatal cells of the mouse midbrain; and (d) detection of Dyrk1a and DAT expression by qRT-PCR, ∗: P < 0.05, ∗∗: P < 0.01, and ∗∗∗: P < 0.001 vs. the control group. #: P < 0.05, ##: P < 0.01, and ###: P < 0.001 vs. the MPTP group.