
FIGURE 1.
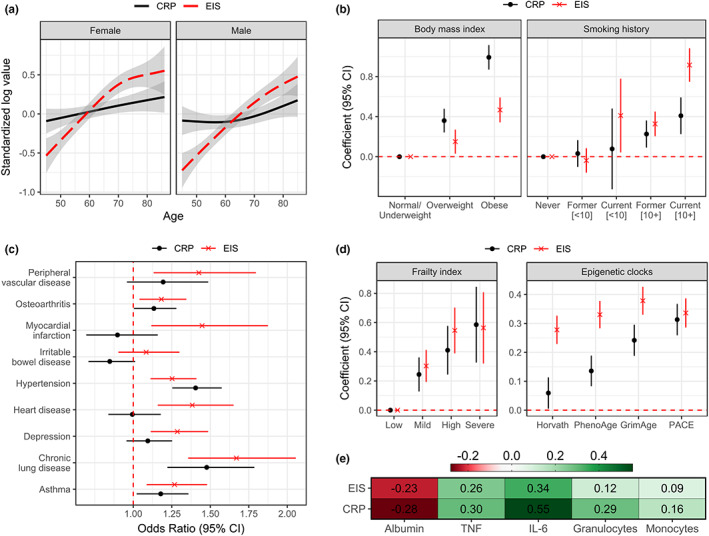
Associations of the EIS and circulating CRP with baseline demographics and health‐related traits in participants of the CLSA (n = 1446). (a) Trends in the mean and 95% confidence interval (CI) of the standardized log levels of EIS and CRP are shown for chronological age in women and men. (b) The difference (coefficient) and 95% CI of the standardized measures for each smoking history group (pack‐years shown in square brackets), relative to never smokers, and obesity (BMI) groups, relative to normal/underweight. (c) The odds ratio and 95% CI of having a given inflammatory chronic condition for every 1‐standard deviation (SD) increase in each measure. (d) The difference (coefficient) and 95% CI of the standardized measures for each level of frailty, relative to low frailty, and for every 1‐SD increase in a given epigenetic clock. (e) Pearson correlation coefficients for standardized circulating inflammatory markers relative to EIS or CRP. For b–d, models were adjusted for age and sex, and the red dotted line represents no significant difference or correlation.