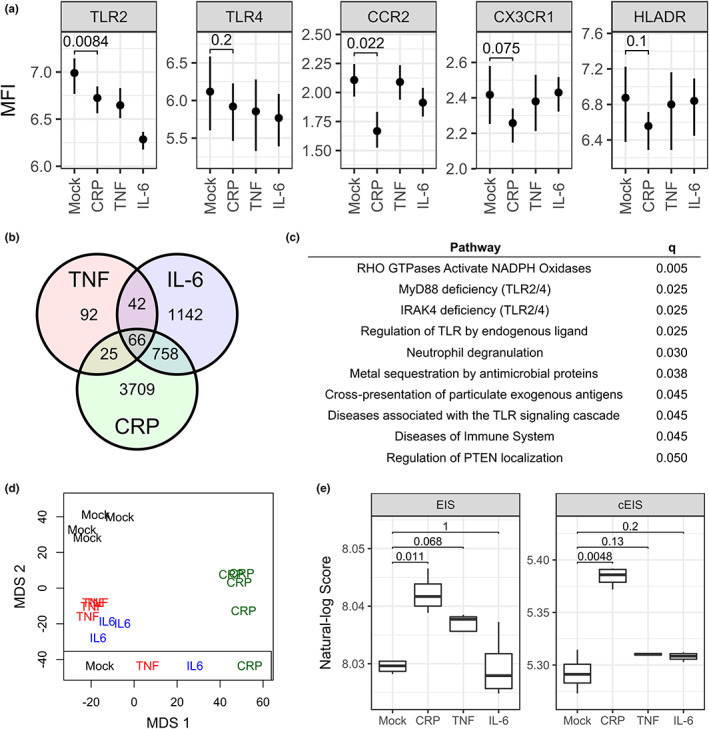
FIGURE 4.

Molecular alterations in THP‐1 myelo‐monocytes as a result of long‐term exposure to CRP, TNF and IL‐6. (a) Cell‐surface receptor expression following 14‐day treatment, expressed as the log mean fluorescent intensity (MFI); p‐values shown for CRP vs. mock comparison. (b) Venn diagram of mRNA identified as differentially expressed relative to mock treatment following transcriptomic analysis. (c) Reactome pathways enriched in the differentially expressed mRNA set for CRP vs. mock; only those with q ≤ 0.05 are shown. (d) Clustering of replicates according to treatment is shown by multidimensional scaling (MDS) plot for the top 100,000 most variable CpGs across all samples. (e) The EIS and cEIS in response to each treatment; p‐values for each comparison are shown.
