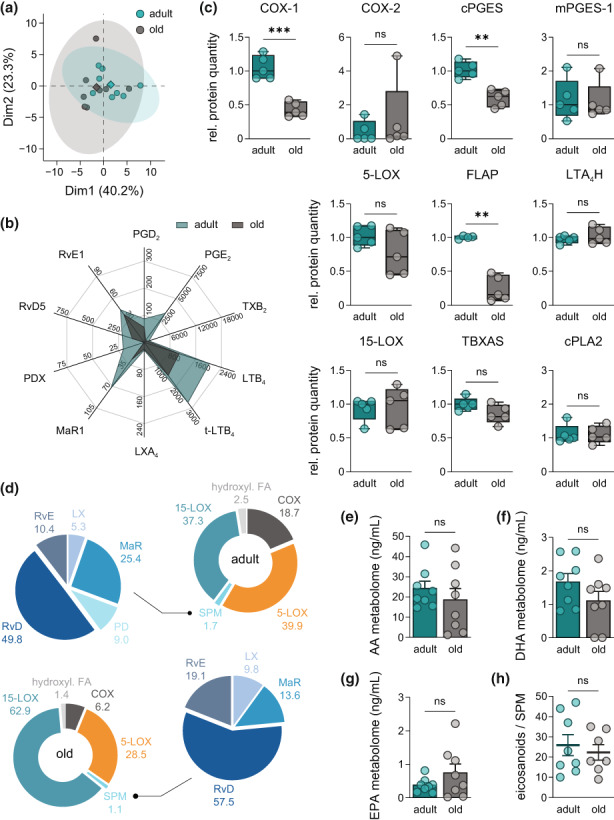
FIGURE 2.

Aging compromises the metabololipidome of E. coli‐infected peritoneal macrophages. (a) PCA of the metabololipidomic profile of PM from adult and old mice after E. coli infection (Table S6; n = 8). (b) Radar chart of selected bioactive LM released by PM of adult and old origin after E. coli infection (Table S6; n = 8; unit: pg/mL). (c) Relative abundance of COX‐1, COX‐2, cPGES, mPGES‐1, 5‐LOX, FLAP, LTA4H, 15‐LOX, TBXAS, and cPLA2 in PM from adult and old mice, measured by DIA mass spectrometry (n = 5). (d) Composition of the metabololipidome of adult and old PM after E. coli infection (Table S6; n = 8). Metabolites were grouped as follows: COX‐2 – PGD2, PGE2, PGF2α, TXB2; PGE1; 5‐LOX – LTB4, t‐LTB4, epi t‐LTB4, 5‐HETE, 5‐HEPE, 5S,6R‐diHETE; SPM – LXA4, AT‐LXA4, LXA5, LXB4, MaR1, MaR2, PD1, PDX, RvD1, AT‐RvD1, RvD2, RvD3, RvD4, RvD5, RvE1; 15‐LOX – 14‐HDHA, 17‐HDHA, 12‐HEPE, 15‐HEPE, 12‐HETE, 15‐HETE, 5,15‐diHETE; hydroxylated FA – 4‐HDHA, 7‐HDHA, 10‐HDHA, 13‐HDHA, 11‐HEPE, 18‐HEPE, 8‐HETE, 11‐HETE, 9‐HODE, 13‐HODE. Fatty acid metabolomes are given as sum of all metabolites from (e) AA, (f) DHA and (g) EPA released by PM of adult and old mice after infection with pathogenic E. coli (Table S6; n = 8). (h) Ratio of pro‐inflammatory PGE2, LTB4, t‐LTB4, and epi t‐LTB4 to all SPM (see above) released by adult and old PM after E. coli infection (Table S6; n = 8). Statistics: Data are shown as (b, d) mean or (c) median (min to max) or (e–h) mean ± SEM and p‐values were calculated by unpaired two‐tailed Student's t‐test with or without Welch's correction (Table S7). **p ≤ 0.01, ***p ≤ 0.001, ns, not significant.
