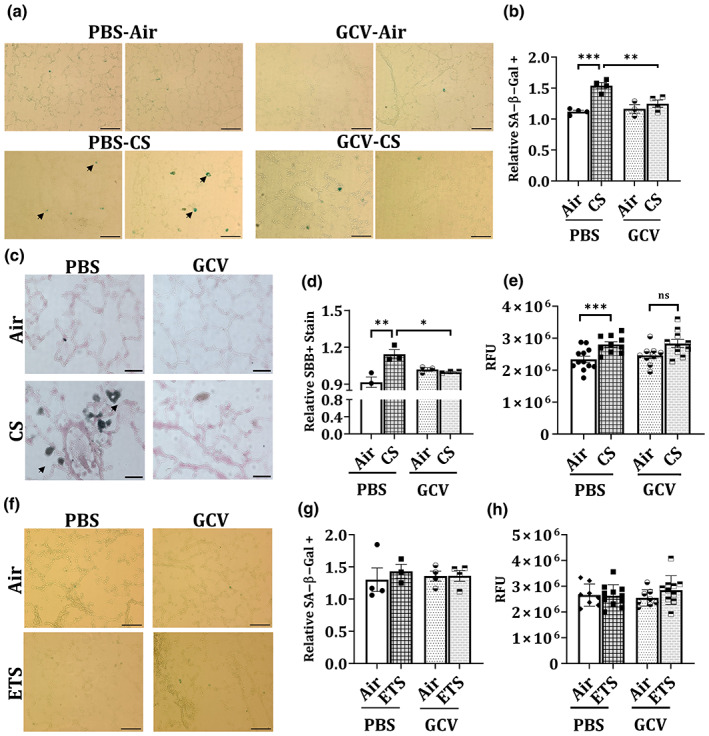
FIGURE 2.

Five‐day GCV treatment significantly reverses CS‐induced cellular senescence in p16‐3MR mice as shown by SA‐β‐Gal and SBB staining. p16‐3MR mice were subjected to chronic (3 months) CS exposure, followed by 5‐day treatment with GCV (25 mg/kg body weight) or PBS (control). The lung tissues from air‐ and CS‐exposed mice were harvested and SA‐β‐Gal staining was performed. Scale bar: 100 μm (20×). Arrows denote senescent cells as stained by SA‐β‐Gal stain. (a) Representative images of n = 2–4/group were provided and (b) the quantified counts were plotted as mean ± SEM. SBB staining in OCT‐fixed lung tissue sections was performed. Scale bar: 100 μm (20×). Arrows denote senescent cells as stained by SBB stain. (c) Representative images of n = 2–4/group were provided and (d) the quantified counts were plotted as mean ± SEM. SE: *p < 0.05, **p < 0.01 and ***p < 0.001; as per one‐way ANOVA for multiple comparisons. (e) The SA‐β‐Gal activity in the lung tissues from CS‐exposed mice was analyzed using ELISA‐based assay. p16‐3MR mice were subjected to chronic (6 months) ETS exposure, followed by 5‐day treatment with GCV (25 mg/kg body weight) or PBS (control). The lung tissues from air‐ and ETS‐exposed mice were harvested and SA‐β‐Gal staining in OCT‐fixed lung tissue sections was performed. (f) Representative images of n = 3–4/group were provided and the (g) quantified counts were plotted as mean ± SEM. Scale bar: 100 μm (20×). (h) The SA‐β‐Gal activity in the ETS‐exposed lung tissues was analyzed using ELISA‐based assay.
