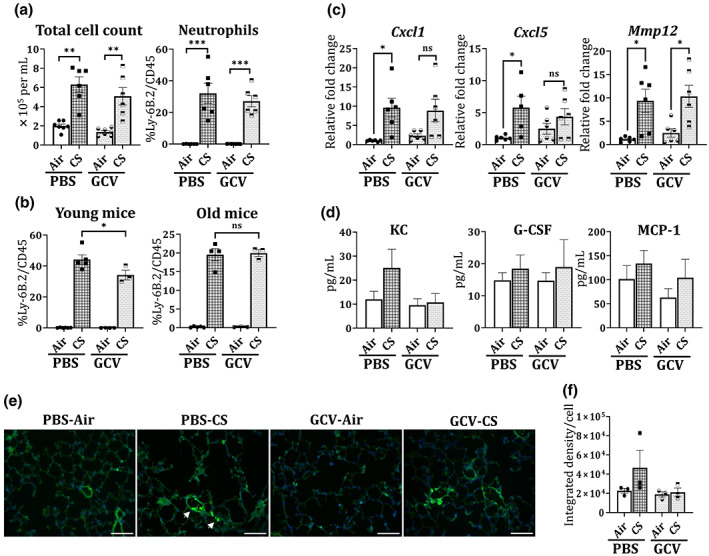
FIGURE 3.

GCV treatment reverts the CS‐induced neutrophilic increase in the BALF of young p16‐3MR mice. BALF from the lungs of PBS/GCV‐treated and air/CS‐exposed (3 months) p16‐3MR mice was obtained. Total cell count was determined using AO/PI staining. Flow cytometry was used to determine the immune cell population (neutrophils, CD4+ and CD8+ T‐cells) in BALF from control and treated mice. (a) The changes in the total and neutrophil population was plotted as bar graph. Data are shown as mean ± SEM (n = 6–7/group); **p < 0.01 and ***p < 0.001 between groups, per one‐way ANOVA for multiple comparisons. (b) The effect of CS‐exposure on neutrophil number was re‐plotted for young and old mice. Data are shown as mean ± SEM (n = 3–5/group); *p < 0.05 versus PBS‐CS, per one‐way ANOVA for multiple comparisons. ns: not significant. The total RNA from the lung tissues of PBS/GCV‐treated and air/CS‐exposed (3 months) p16‐3MR mice was obtained. (c) Alterations in the mRNA expression of Cxcl1, Cxcl5 and Mmp12 gene expression was determined using qPCR. 2−∆∆Ct method was used to determine the changes in the gene expression and fold changes relative to PBS‐Air were plotted. Data are shown as mean ± SEM (n = 5–6/group). SE: *p < 0.05 versus PBS‐Air; as per one‐way ANOVA for multiple comparisons. Here; ns: not significant. (d) The levels of inflammatory cytokine/chemokine were determined using Luminex and levels of KC, G‐CSF and MCP‐1 plotted in pg/mL. Data are shown as mean ± SEM (n = 7–11/group). Lung tissue slices were stained with Ly6 B.2 and DAPI nuclear stain. Increased infiltration of neutrophils into the CS‐exposed mouse lungs was studied under fluorescence microscope. (e) Representative images of n = 3/group were provided and the (f) integrated fluorescence density per cell was plotted as mean ± SEM. Scale bar: 100 μm (20×). Arrows indicate Ly6 B2 stained cells (neutrophils) on CS exposure.
