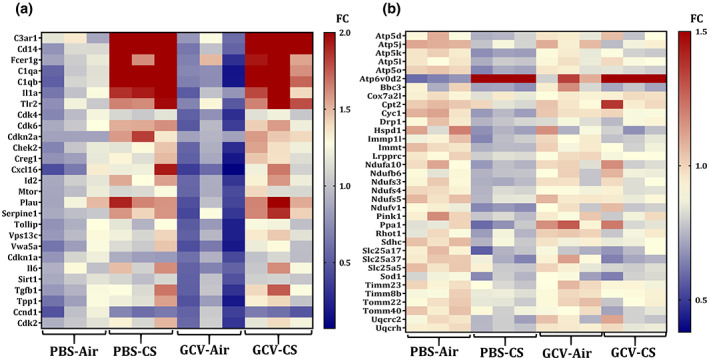
FIGURE 4.

Transcript levels of senescence and mitochondrial function‐associated genes are altered in PBS/GCV treated CS‐exposed p16‐3MR mice. Total RNA was isolated from the lungs of PBS/GCV treated and air/CS‐exposed (3 months) p16‐3MR mice. Our customized NanoString panel (senescence) was used to screen the potential targets via nCounter SPRINT Profiler. Changes in the normalized counts of respective genes were obtained relative to PBS‐Air group and plotted as heat map. Heat map showing fold changes (FC) in the expression of (a) senescence and (b) mitochondrial function associated genes is graphed relative to PBS‐Air group.
