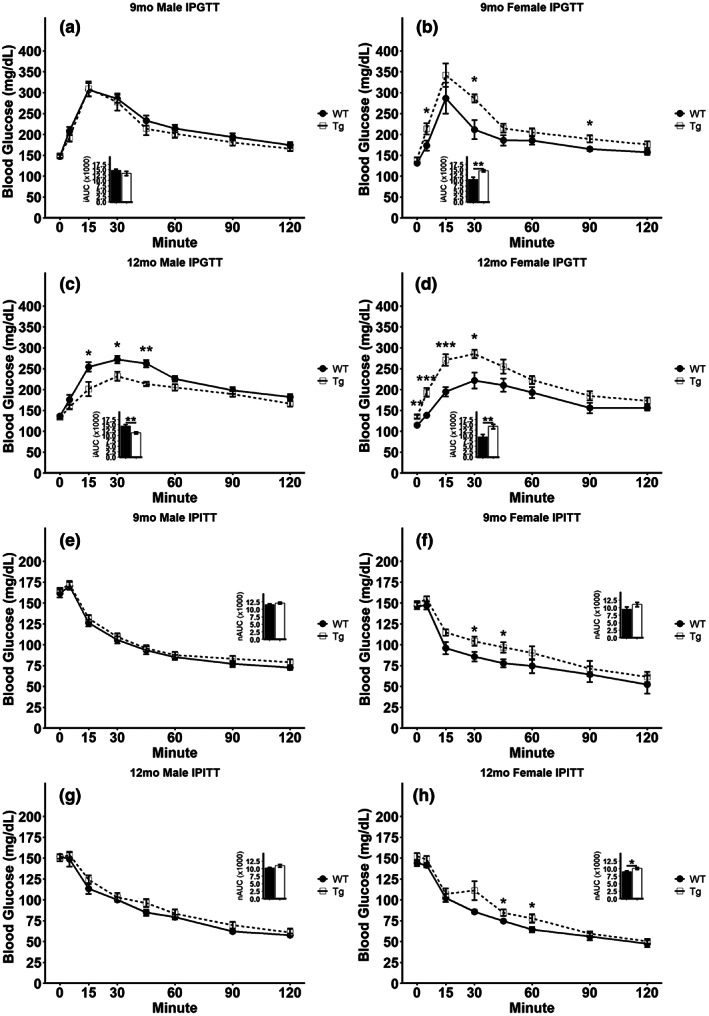
FIGURE 3.

Disrupted glucose tolerance and insulin sensitivity in TgF344‐AD rats. (a–d) Glucose tolerance test in overnight fasted 9‐month‐old males (a) or females (b) and 12‐month‐old males (c) or females (d). Insets represent incremental area under the curve (iAUC) analyses for the data presented in (a–d). (e–h) Insulin tolerance test in 4 h fasted 9‐month‐old males (e) or females (f) and 12‐month‐old males (g) or females (h). Insets represent net area under the curve (nAUC) analyses for the data presented in e–h. Data presented as mean ± SEM with points representing individual rats. Statistical comparison was performed by two‐tailed t‐test with the welch correction applied where appropriate. WT‐wild‐type rats; Tg‐TgF344‐AD rats. N = 8–10 per group (a–d) or 6–9 per group (e–h). *p < 0.05, **p < 0.01, ***p < 0.001.
