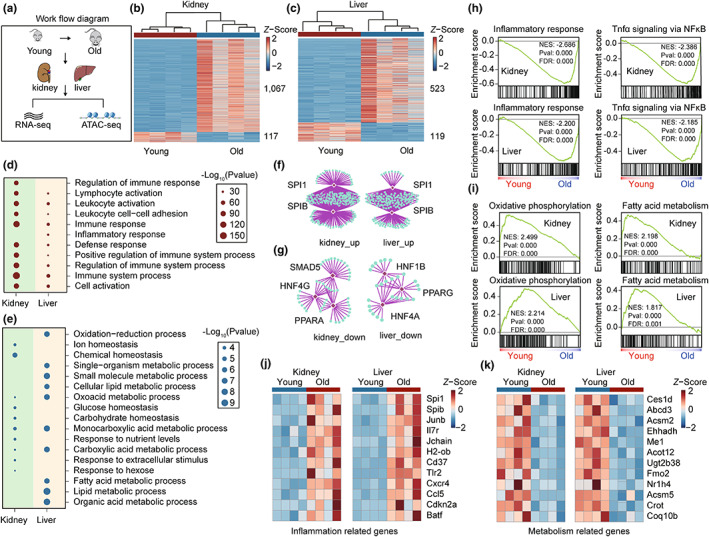
FIGURE 1.

Enhanced inflammation and dysregulated metabolism in the kidney and liver during aging. (a) Schematic outlining the experimental design. The kidney and liver from young (2–3 months) and old (23–25 months) C57BL/6 mice were used for RNA‐seq and ATAC‐seq analysis. (b, c) Heatmap of aging‐associated differentially expressed genes in the kidney (b) and liver (c), (n = 4). (d,e) Selected biological process (BP) GO terms enriched in aging‐associated upregulated genes (d) and downregulated genes (e) in the kidney and liver, with the top 10 most significantly enriched terms shown. The size of each point represents the significance of the enrichment. (f,g) Transcription factor enrichment analysis based on aging‐associated upregulated genes (f) and downregulated genes (g) in the kidney and liver using RcisTarget. Only the top significantly enriched TFs are shown. (h,i) GSEA showing changes in inflammation‐related (h) and metabolism‐related (i) pathways in the kidney and liver during aging based on the transcriptome, (n = 4). (j,k) Heatmap showing changes in the expression of selected inflammation‐related (j) and metabolism‐related genes (k) in the kidney and liver, (n = 4).
