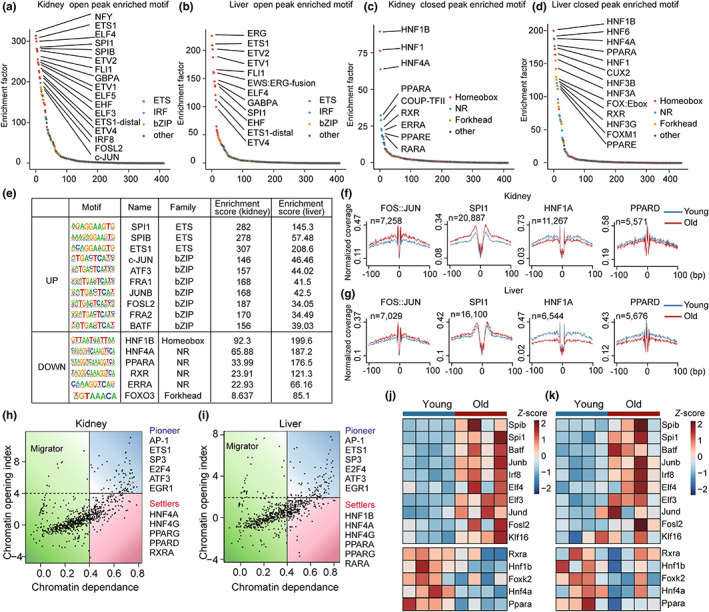
FIGURE 3.

Identification of the regulatory TFs of aging in the kidney and liver. (a–d) Ranking of motifs enriched in aging‐associated open peaks in the kidney (a) and liver (b), and closed peaks in the kidney (c) and liver (d). The colors of the points represent different TF families. (e) Selected commonly enriched TFs in aging‐associated peaks in the kidney and liver. (f,g) TF footprinting in chromatin‐accessible regions based on ATAC‐seq. The mean normalized ATAC‐seq coverage of the forward and reverse strands within 100 bp upstream and downstream of the TF motif is shown. For both the kidney (f) and liver (g), the red line represents young samples and the blue line represents old samples. (h,i) Classification of TFs based on chromatin dependence (CD) and the chromatin opening index (COI). Selected top pioneer factors and settlers in the kidney (h) and liver (i) are shown. (j,k) Heatmap showing changes in the expression levels of identified regulatory TFs with aging in the kidney (j) and liver (k) during aging, (n = 4).
