
FIGURE 3.
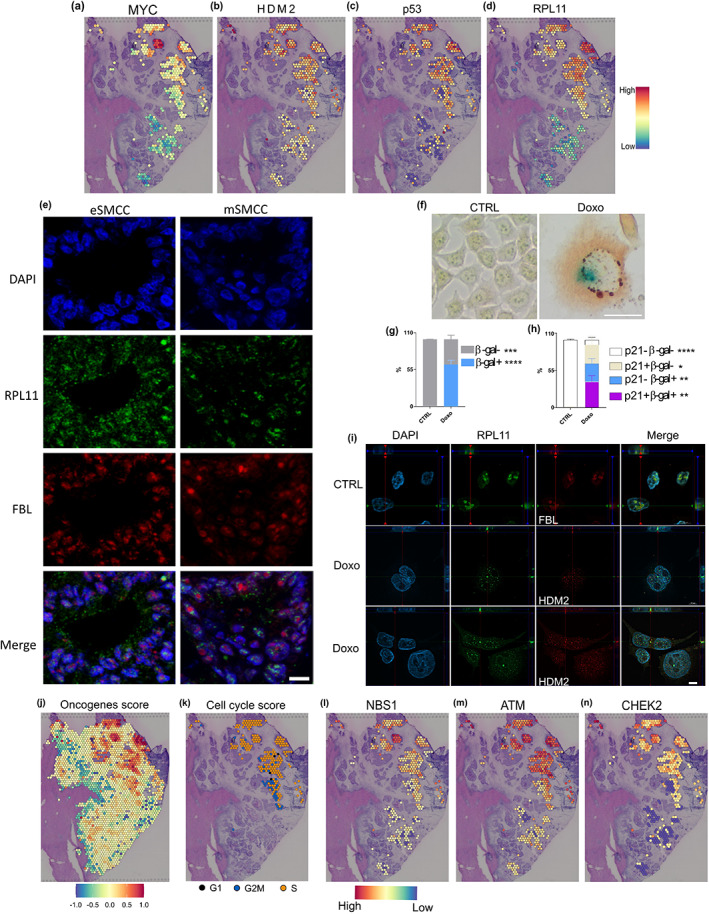
Nucleolar stress drives the eSMCC signature. (a–d) Activity maps of genes involved in HDM2‐p53 axis. (e) Z‐stack projection of RPL11 and FBL immunofluorescence on selected areas of eSMMCs and mSMMCs on meta1, bar 10 μm. (f) Co‐staining of p21 protein (brown) and β‐gal enzymatic activity (blue) on HCT‐116 cell line (CTRL vs. Doxo), bar 100 μm. Quantification of β‐gal (g) and p21‐positive cells (h) scored by optical evaluation over three experiments. T test, *p < 0.05; **p < 0.01; ***p < 0.001; ****p < 0.0001. (i) Representative single focal plane of Z‐stacks for RPL11, FBL, and HDM2 immunofluorescence on doxorubicin‐exposed HCT‐116 cells and control, bar 20 μm. (j) Oncogene activation score. (k) Cell cycle phase analysis. (l) DNA damage sensor, upstream (m) and downstream (n) kinase activity maps.