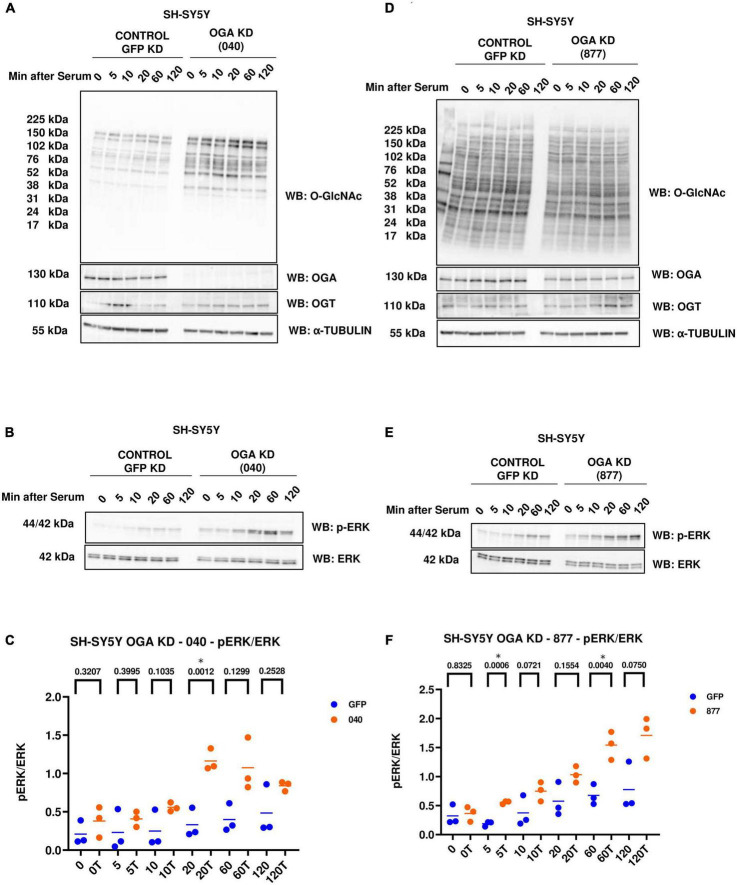
FIGURE 4.
Western blot analysis of samples harvested after serum reactivation time course of SH-SY5Y OGA KD cells (A,B) 040 and (D,E) 877. (C,F) Densitometry plot of ERK 1/2 phosphorylation normalized to total ERK 1 in SH-SY5Y cells with (C) OGA KD 040 (n = 3) and (F) OGA KD 877 (n = 3), where n = total number of experimental trials. The dots represent the number of experimental trials (n). Statistical significance was measured using paired-t-test analysis and p-value is indicated on the plots. *Is added for p-values that are significant (p < 0.05).

