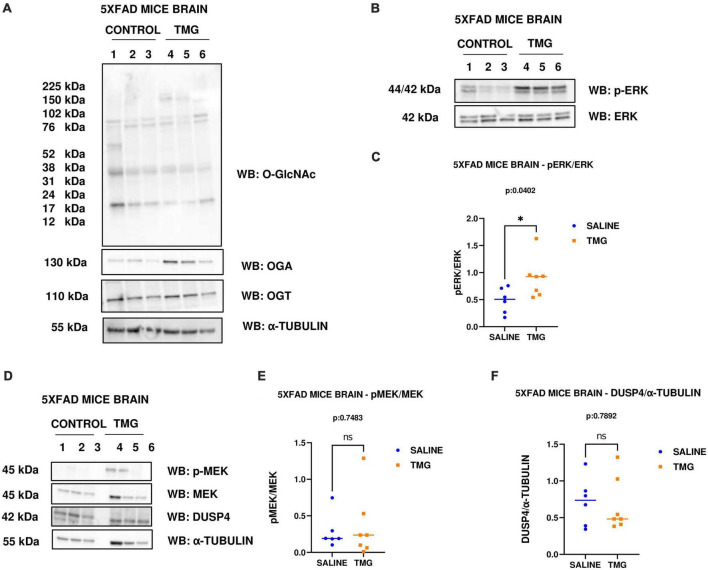
FIGURE 7.
Western blot analysis of total brain lysate of 5XFAD mice subjected to intra-peritoneal TMG injection for 1 month. The blots were probed for panel (A) O-GlcNAc, OGA, OGT, α-Tubulin (B) p-ERK 1/2, Total ERK 1, and APP (D) p-MEK 1/2, MEK 1/2, Dusp4 and α-Tubulin. Densitometry plot of panel (C) ERK 1/2 phosphorylation normalized to total ERK 1 (E) MEK 1/2 phosphorylation normalized to total MEK 1/2 and (F) DUSP4 normalized to α-tubulin in 5XFAD mice brains. The dots represent the number of mice (n = 6 for control and n = 7 for TMG injected mice). Statistical significance was measured using un-paired-t-test analysis and p-value is indicated on the plots. *Indicates p-values that are significant (p < 0.05).

