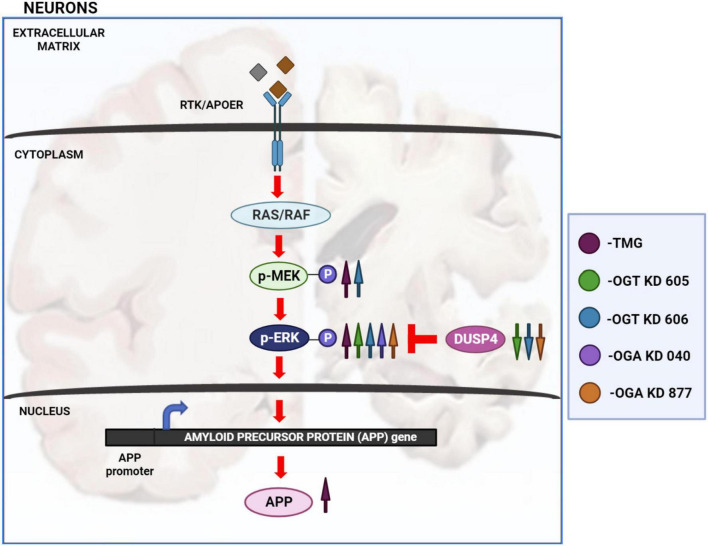
FIGURE 8.
Changes in O-GlcNAcylation amplify ERK 1/2 signaling. Arrows in magenta indicate long term OGA inhibition via TMG treatment for at least 2 weeks. Green arrows indicate OGT KD via shRNA 605. Blue arrows indicate OGT KD via shRNA 606. Purple arrows indicate OGA KD via shRNA 040. Orange arrows indicate OGA KD via shRNA 877. OGA inhibition via long term TMG treatment, OGT KD and OGA KD, all increase the amplitude of ERK 1/2 phosphorylation. TMG treatment increases ERK 1/2 phosphorylation by increasing the amplitude of MEK 1/2 phosphorylation. The levels of DUSP4 does not change with TMG treatment. OGT KD 606 also increases ERK 1/2 phosphorylation by increasing the amplitude of MEK 1/2 phosphorylation. The levels of DUSP4 decrease with OGT KD 606. OGT KD with shRNA 605 follows a similar trend as OGT KD with shRNA 606 where the levels of DUSP4 decreases. But the increase in MEK 1/2 phosphorylation by OGT KD 605 is not significant. OGA KD with both shRNA 040 and 877 increase ERK 1/2 phosphorylation but increase in the level of MEK 1/2 phosphorylation was not significant. DUSP4 decreases significantly with OGA KD 877 and DUSP4 levels do not change with OGA KD 040. Long term OGA inhibition also increased APP protein levels, correlating with increased ERK phosphorylation.

