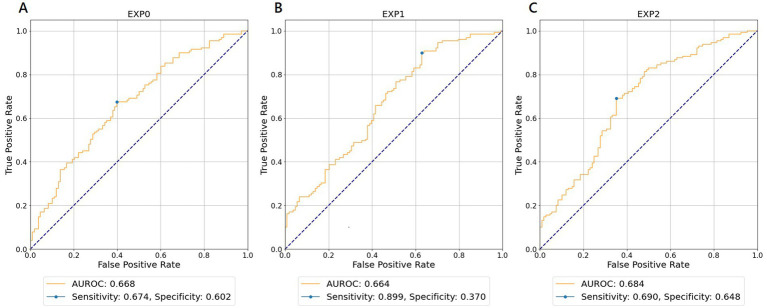
Figure 2.
Receiver operating characteristic curves for wave number of 5 predicting in-hospital all-cause mortality. (A) EXP0 (MD-ECG data and HALF-ENTRY). (B) EXP1 (MD-ECG-ALLST data and HALF-ENTRY). (C) EXP2 (MD-ECG-ALLST data and MAX-ENTRY). EXP, experiment; AUROC, area under the receiver operating characteristic curve; MD-ECG, monitored ECG; ALLST, ALL-STATEMENTS.

