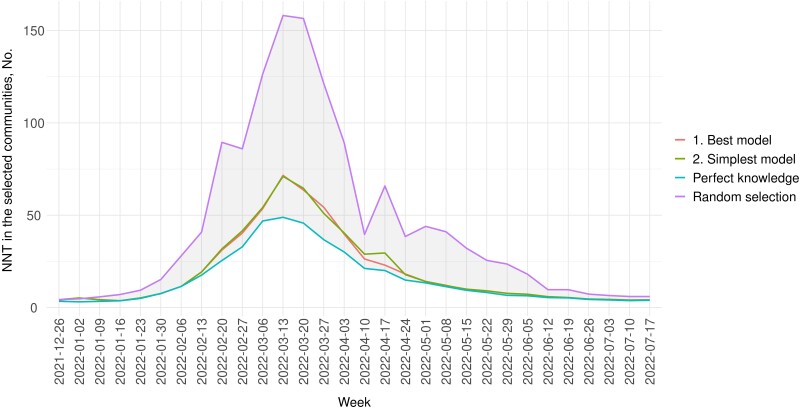
Figure 2.
NNT in the selected communities under intensified testing, December 26, 2021–July 23, 2022. The blue line represents NNT in the targeted communities selected based on perfect knowledge of future test positivity, , which serves as the lower bound for NNT (ie, the most efficient scenario). The purple line (the uppermost line) represents the expected NNT under random selection of communities for targeted testing (ie, the least efficient) and serves as the upper bound. Abbreviation: NNT, number needed to test.

