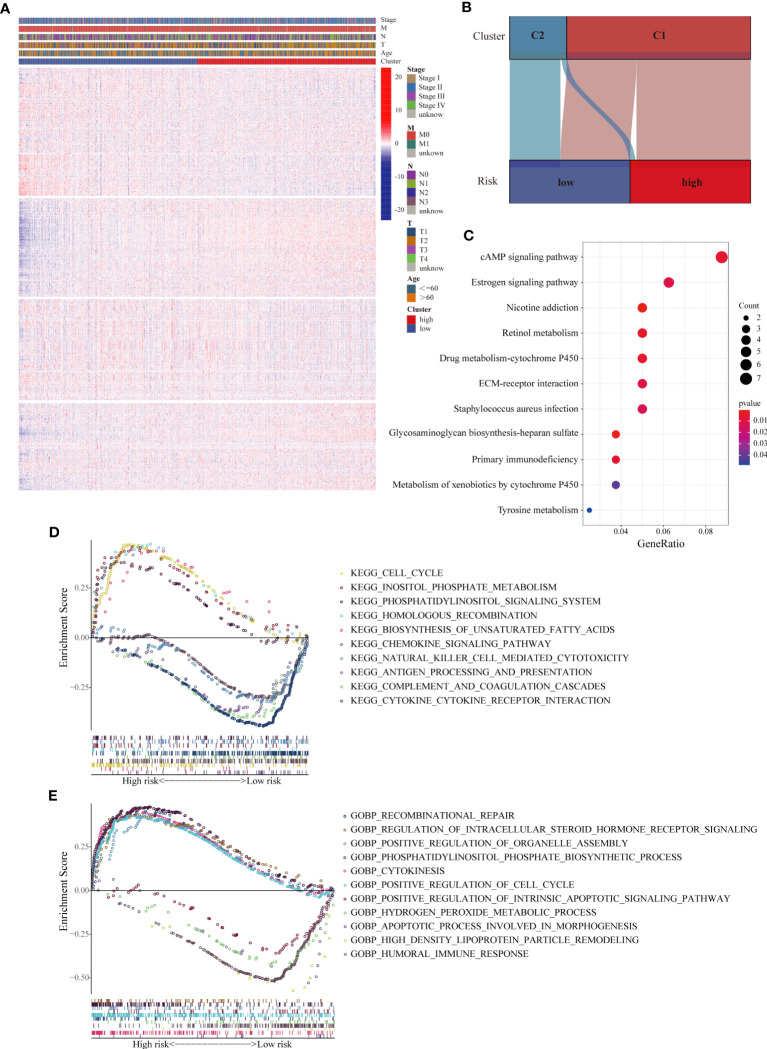
Figure 4.
Analyses of biological processes and pathways related to the LMRG-based signature. (A) Heatmap of the expression levels of all 1034 LMRGs showing distinct expression patterns between the high- and low-risk groups from the TCGA cohort. (B) Correlations between the two clusters and the two risk groups. The majority of patients in Cluster 2 were categorized into the low-risk group. (C) KEGG pathway analysis of the DEGs between the two risk groups, revealing differentially activated pathways. (D, E) Representative KEGG pathways and GO biological processes enriched in the high- and low-risk patients, as determined by GSEA.

