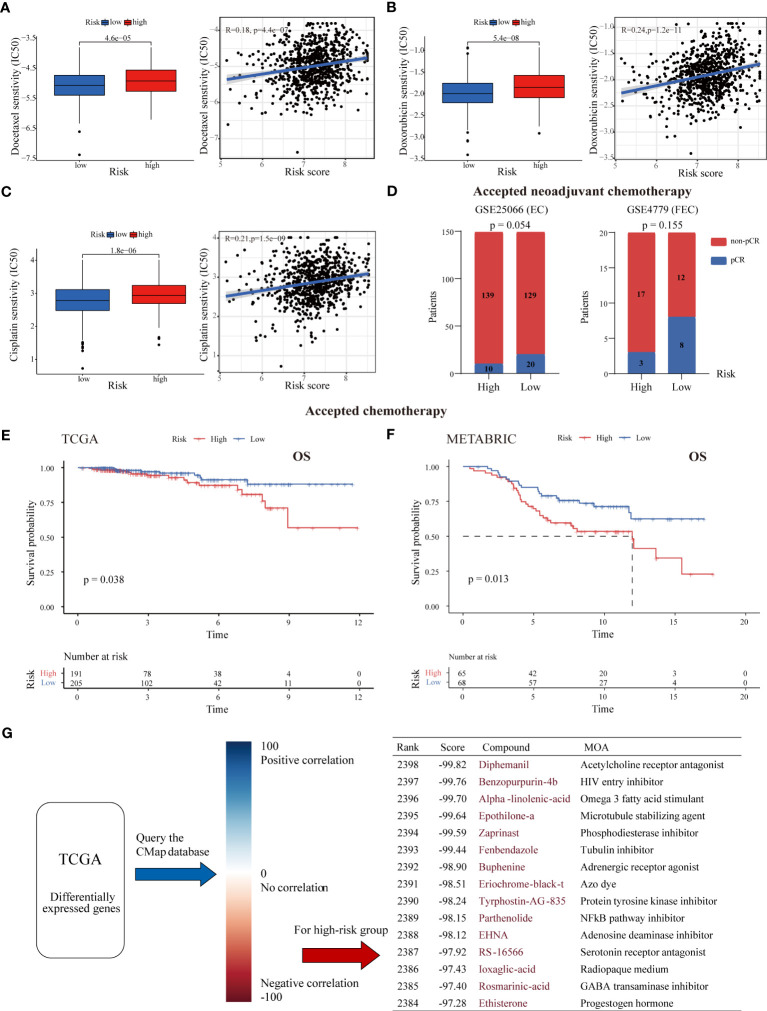
Figure 6.
Association between the risk score and chemotherapy response and drug screening for high-risk tumors. The estimated IC50 values of docetaxel (A), doxorubicin (B), and cisplatin (C) in the low- and high-risk groups. High-risk tumors were more likely to be resistant to chemotherapy. (D) The pCR rate after receipt of neoadjuvant chemotherapy in the two risk groups from the GSE25066 and GSE4779 cohorts. ER+ BC patients with low risk were more likely to achieve pCR. (E, F) K-M survival curves of ER+ BC patients who received chemotherapy stratified by risk score in the TCGA and METABRIC cohorts. (G) CMap analysis of high-risk versus low-risk patients. The DEGs between the two risk groups were uploaded into the CMap database to predict potential drug targets. The top 15 drugs (with negative correlations) for treating high-risk tumors are listed.

