
Figure 3. Brain Amyloid, Plasma Phosphorylated Tau 217 (P-tau217), and Hazard Ratios for Risk of Disease Progression.
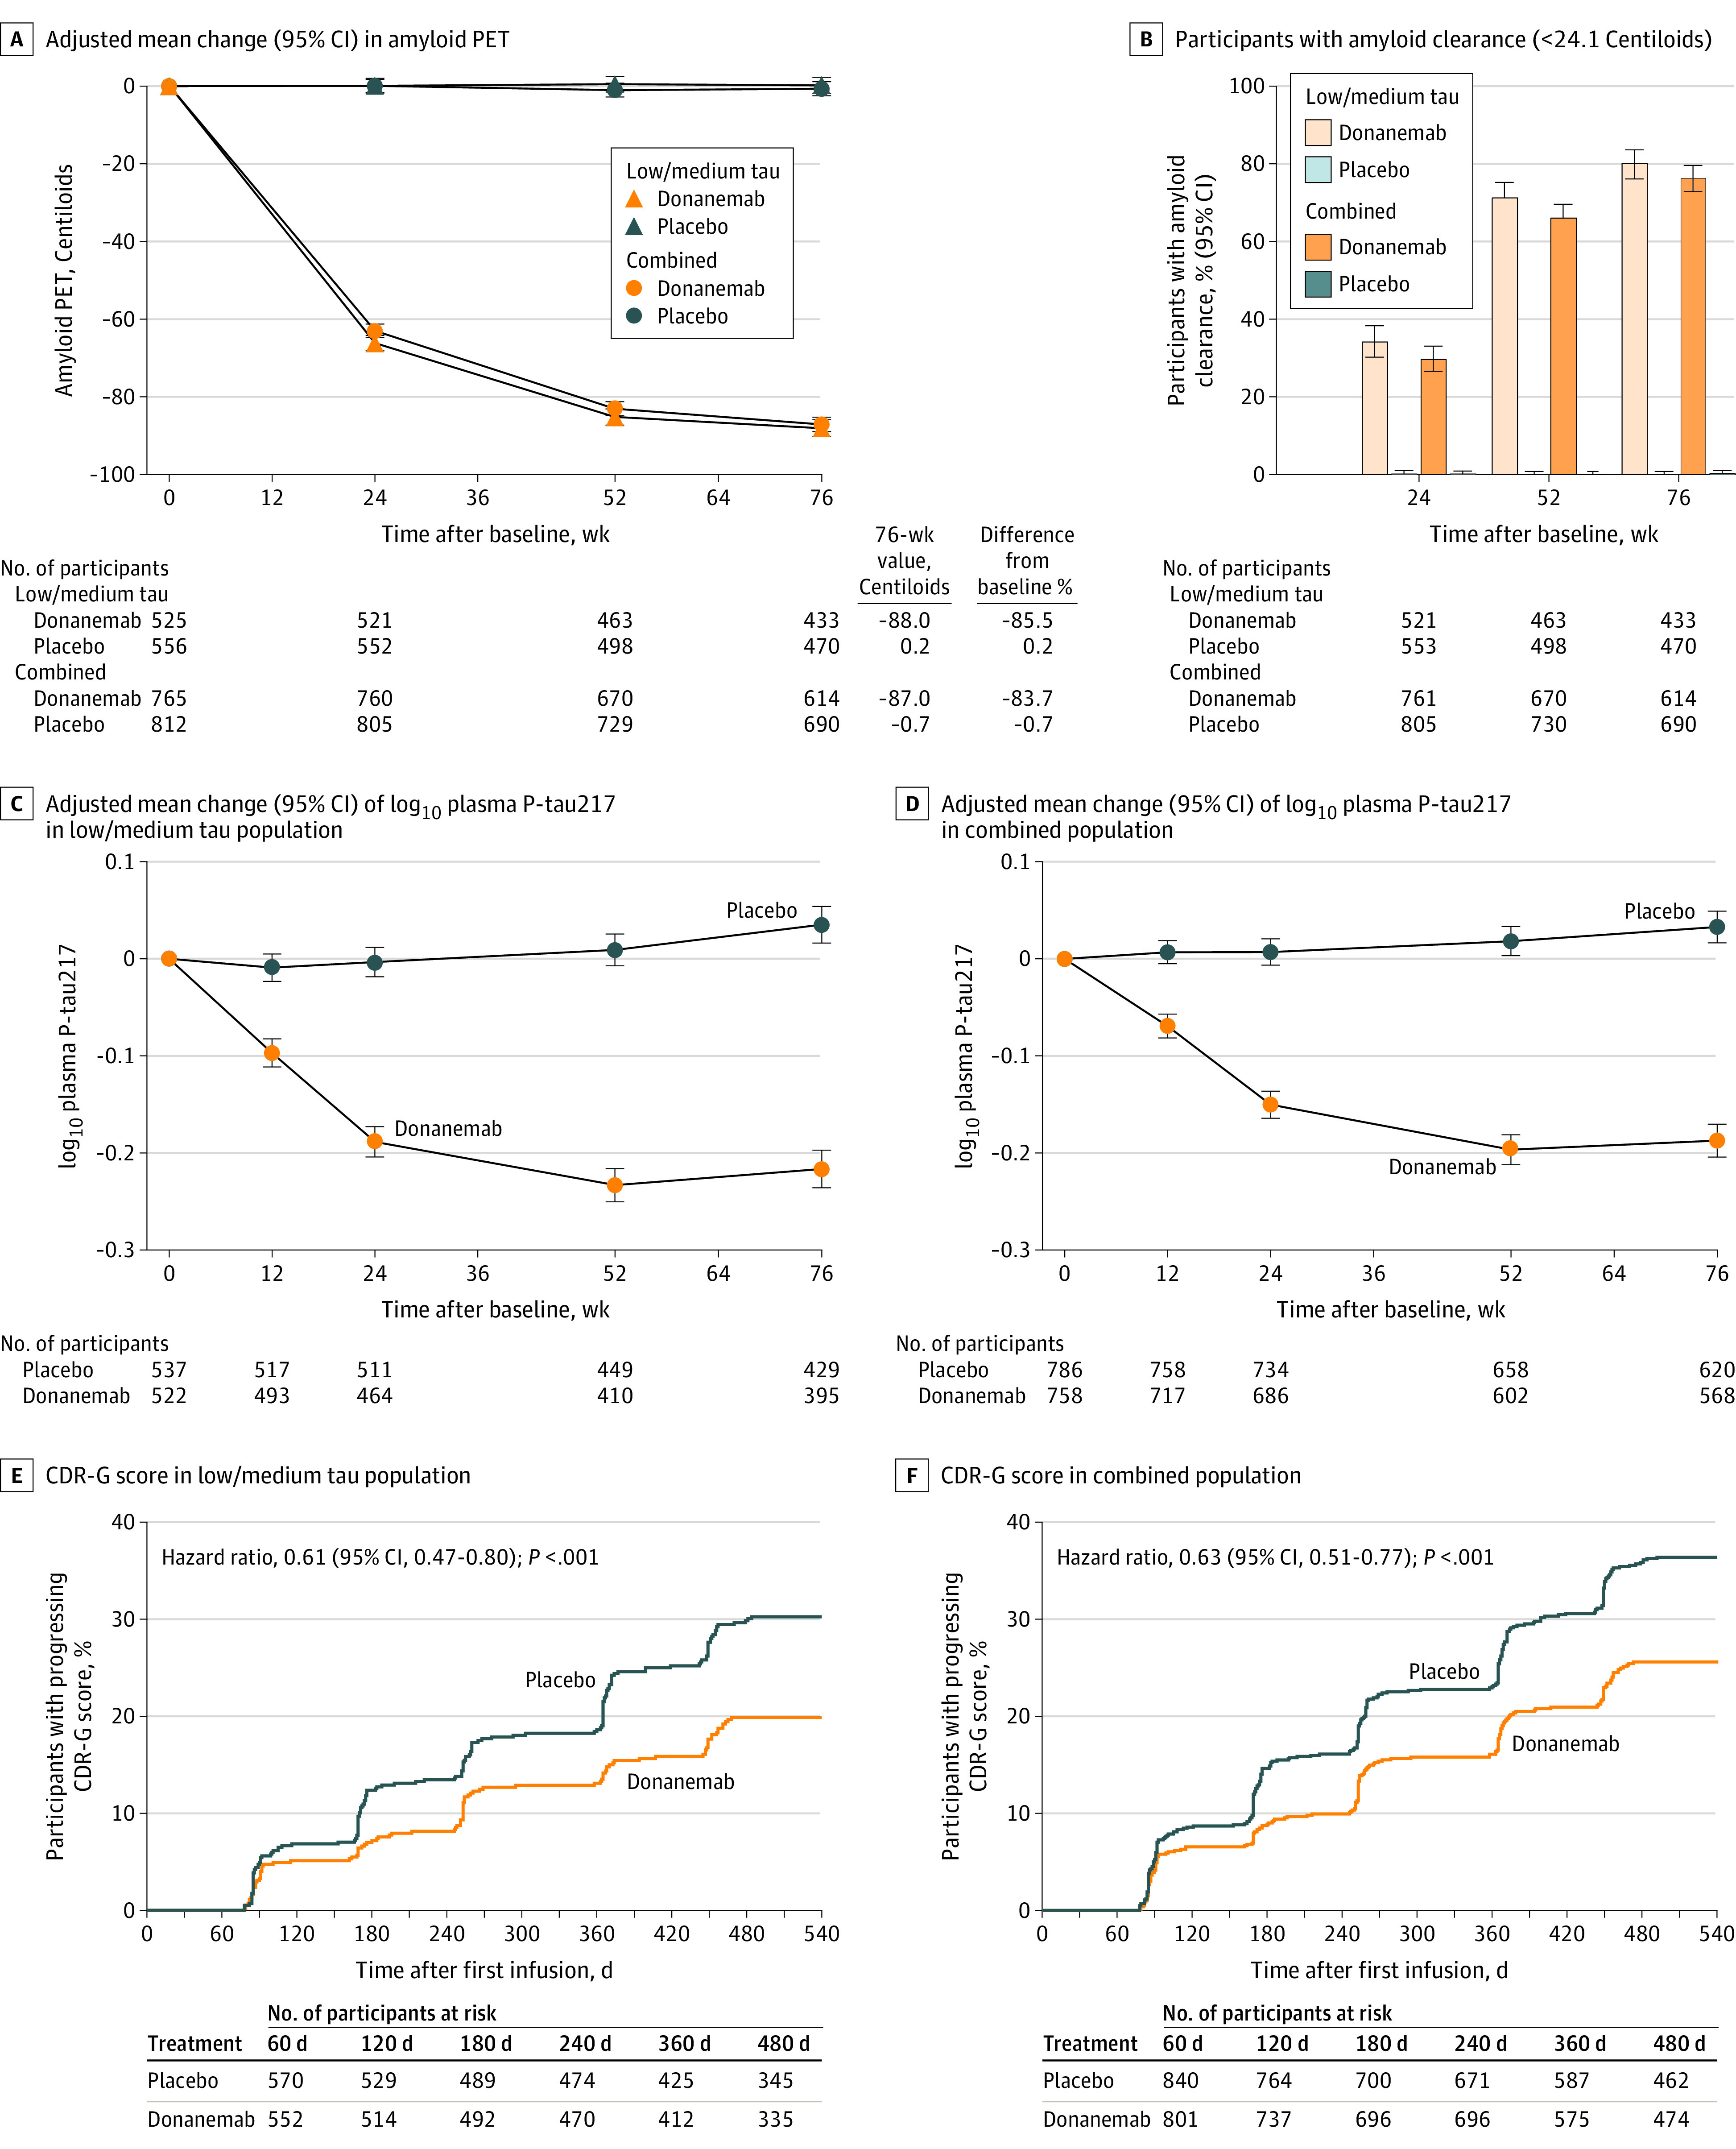
Biomarker data shown were analyzed using mixed models for repeated measures (MMRM). For MMRM analyses, 95% CIs for the least-squares mean changes were calculated with the normal approximation method. P < .001 for all time points in panels A-D. B, P value is from Fisher exact test comparing the percent amyloid negative by treatment groups at each visit. E and F, The analysis was conducted using a Cox proportional hazards model. There were 163 events among 573 participants in the placebo group and 100 events among 555 participants in the donanemab group in the low/medium tau population and 288 events among 844 participants in the placebo group and 186 events among 805 participants in the donanemab group in the combined population. CDR-G indicates Clinical Dementia Rating Global Score.