
Figure 3: Relationship between angiotensinogen level and prevalent hypertension.
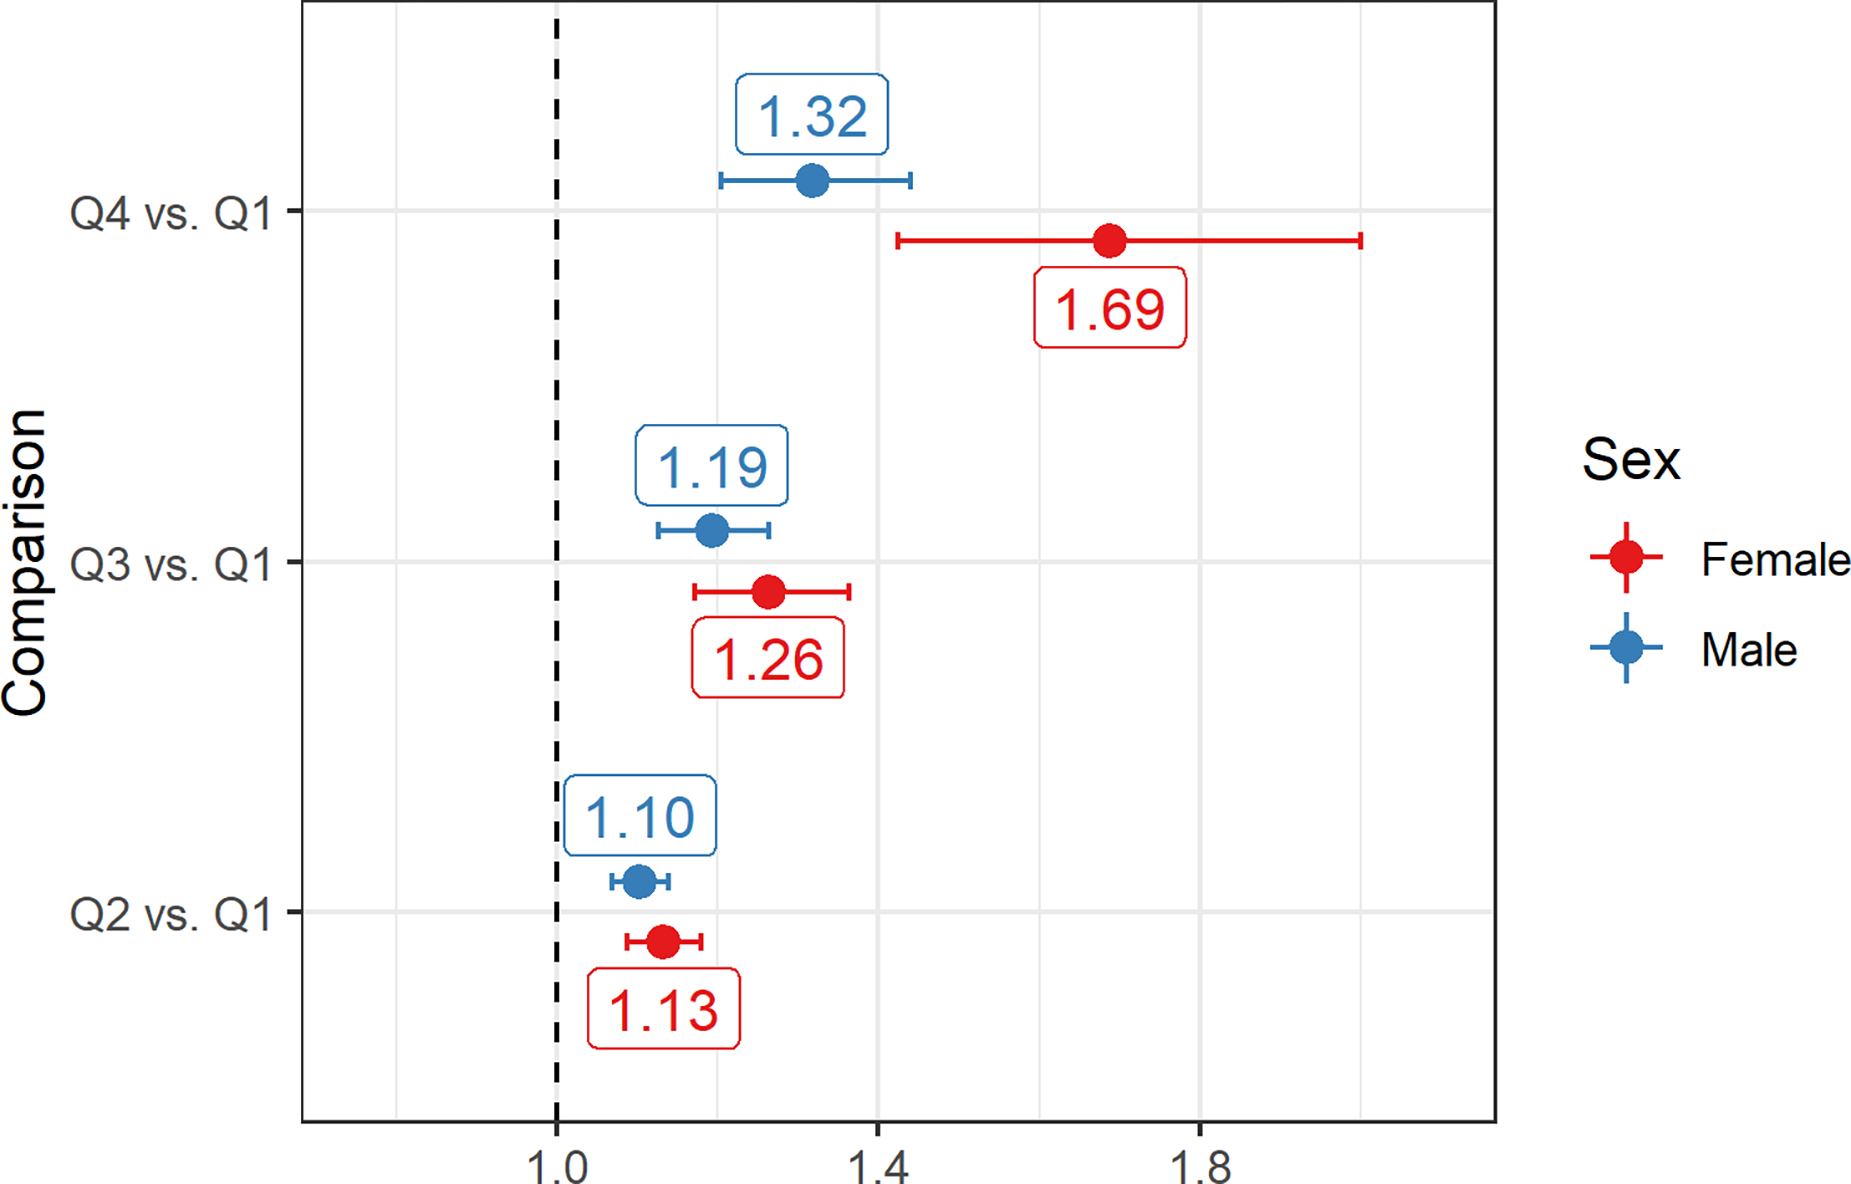
Model adjusted odds ratios for prevalent hypertension comparing subjects in the second (25th – 50th percentile), third (50th – 75th percentile), and fourth quartiles (75th – 100th) to the first quartile (0th – 25th percentile). The midpoint of each interval was utilized for making the comparison. Percentiles were calculated within each sex. Horizontal axis represents the odds ratio (OR) for prevalent hypertension.