
Figure 11.
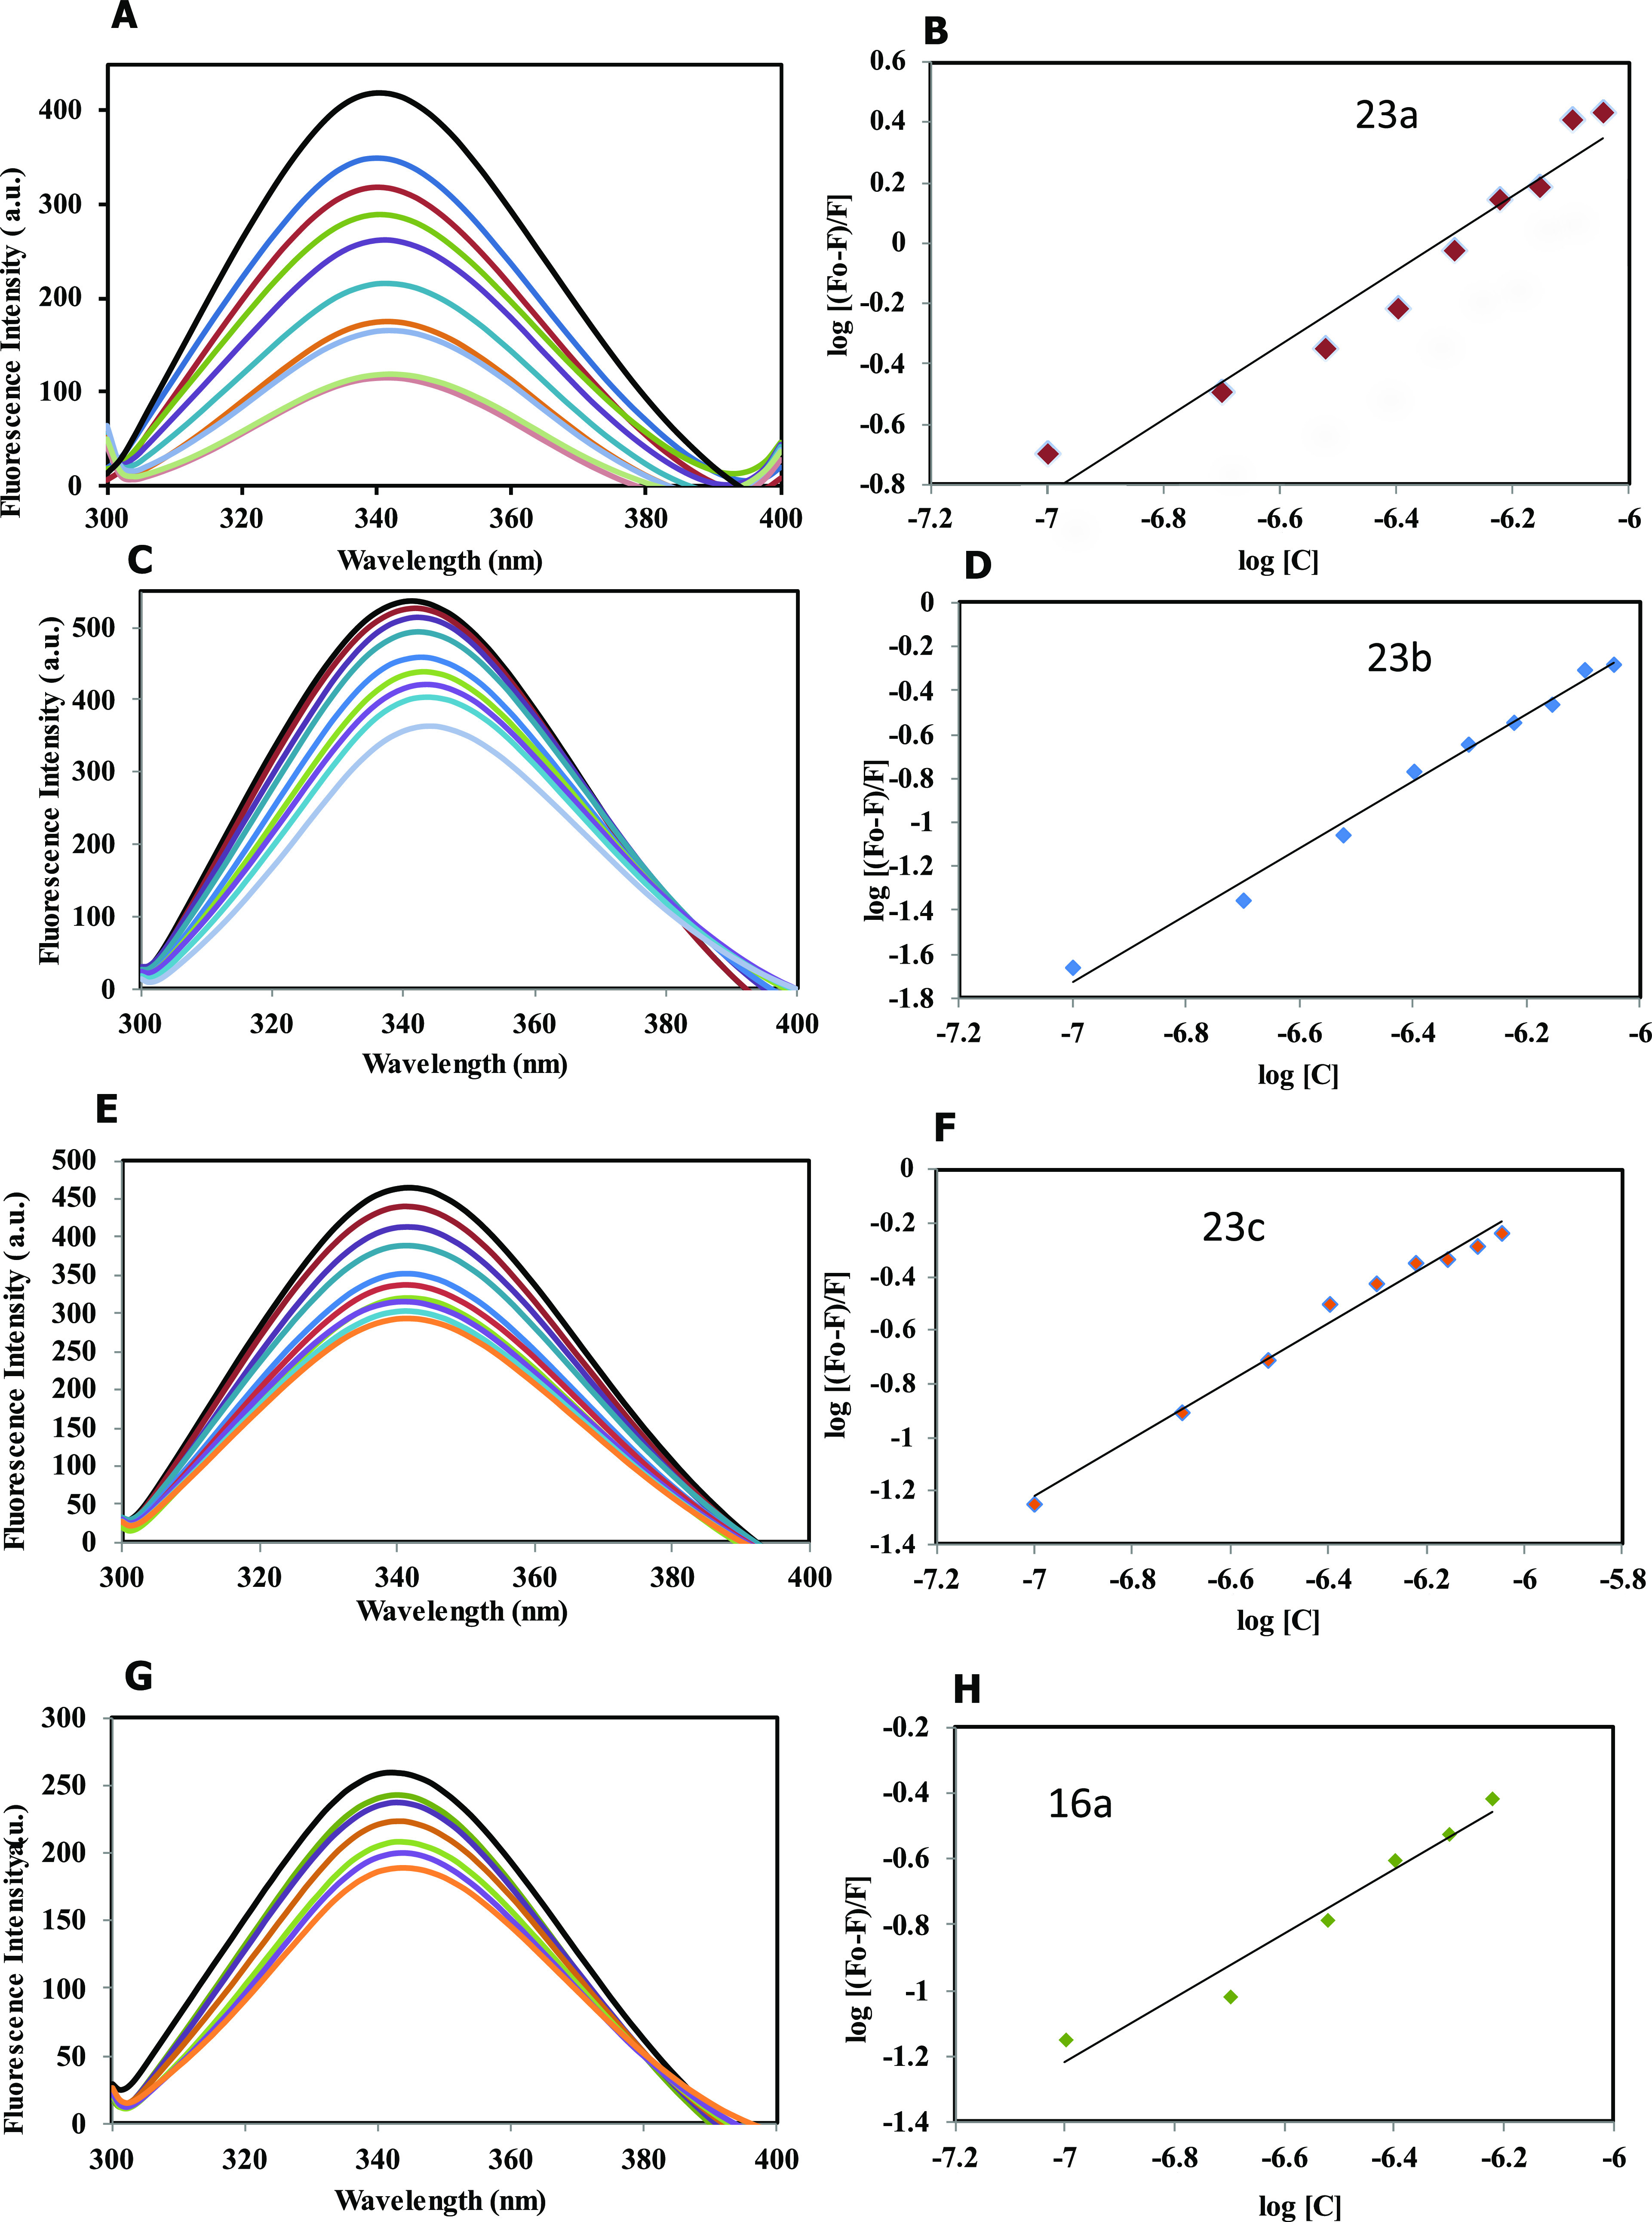
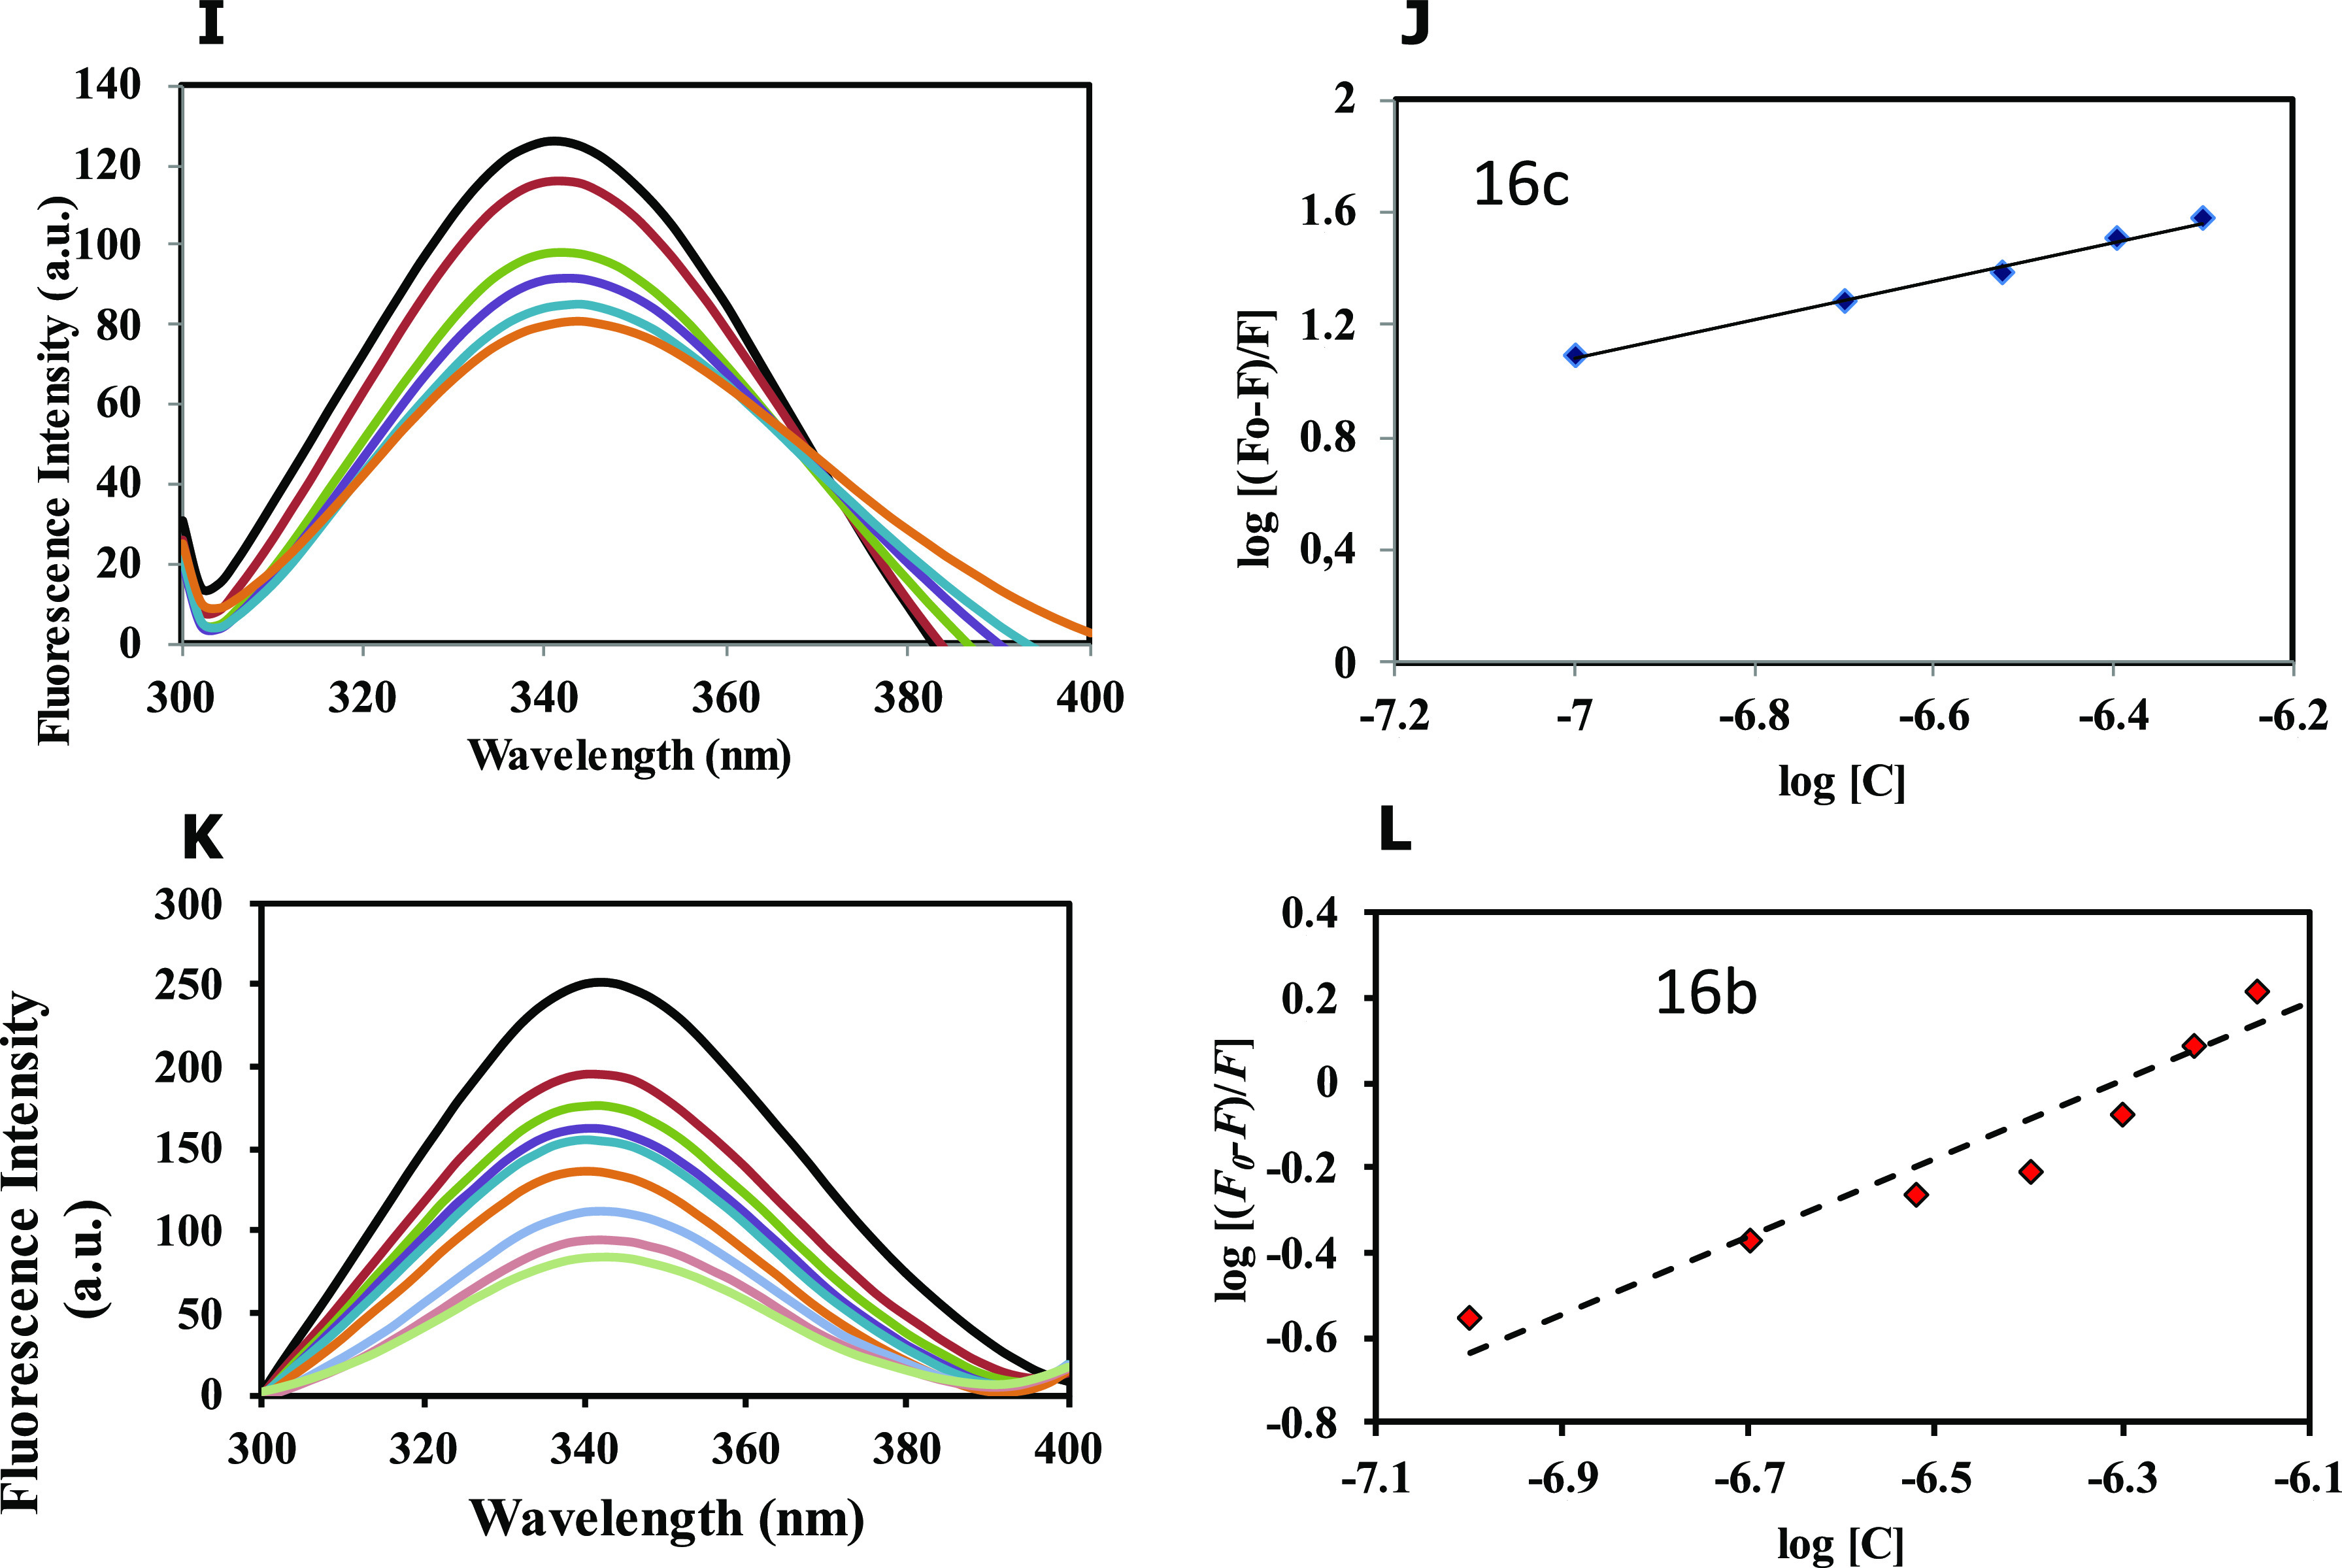
Fluorescence binding studies of MARK4 with the compounds. (A) Fluorescence spectra of MARK4 with increasing concentrations of compound 23a (0.1–0.9 μM). (B) The modified Stern–Volmer (MSV) plot displaying fluorescence quenching of MARK4 by 23a. (C) Fluorescence spectra of MARK4 with increasing concentrations of compound 23b (0.1–0.9 μM). (D) The modified Stern–Volmer (MSV) plot displaying fluorescence quenching of MARK4 by 23b. (E) Fluorescence spectra of MARK4 with increasing concentrations of compound 23c (0.1–0.9 μM). (F) The modified Stern–Volmer (MSV) plot displaying fluorescence quenching of MARK4 by 23c. (G) Fluorescence spectra of MARK4 with increasing concentrations of compound 16a (0.1–0.9 μM). (H) The modified Stern–Volmer (MSV) plot displaying fluorescence quenching of MARK4 by 16a. (I) Fluorescence spectra of MARK4 with increasing concentrations of compound 16c (0.1–0.9 μM). (J) The modified Stern–Volmer (MSV) plot displaying fluorescence quenching of MARK4 by 16c. (K) Fluorescence spectra of MARK4 with increasing concentrations of compound 16b (0.1–0.9 μM). (L) The modified Stern–Volmer (SV) plot displaying fluorescence quenching of MARK4 by 16b.