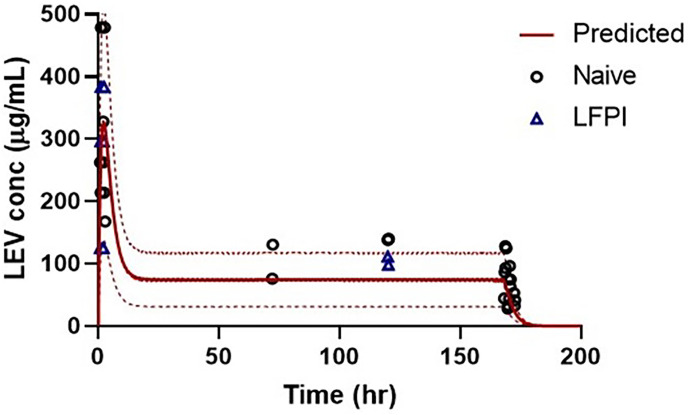
Fig. 4.
Comparison of predicted and observed plasma LEV concentrations after a single i.p. dose (200 mg/kg) LEV administered in naïve rats or immediately after LFPI followed by s.c. continuous infusion of 200 mg/kg per day LEV for 7 days. Predicted concentration shown with line, 95% upper and lower confidence intervals shown with dotted lines, and observed concentrations shown with symbols.

