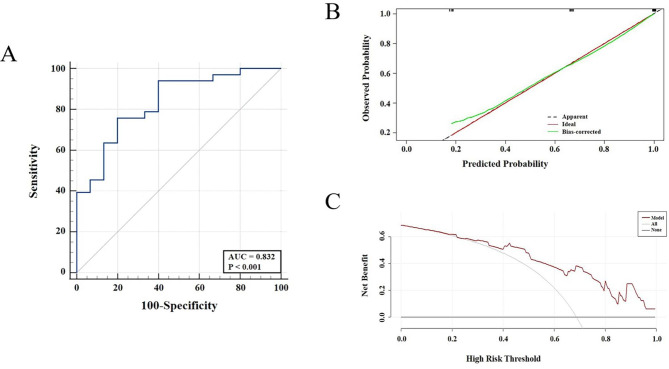
Fig. 6.
The evaluation of the prediction model of AR expression in internal validation using Bootstrap. The ROC curve of the combined model consisted of radiomic features and clinical characters (A); the calibration curve (green) after correction of bias fluctuates around the ideal curve (red), which revealed the good accuracy between the actual probability and predicted probability (B); decision curve showed that the prediction model led to a higher net benefit than intervention or no-intervention of all patients among a large range of threshold (C)

