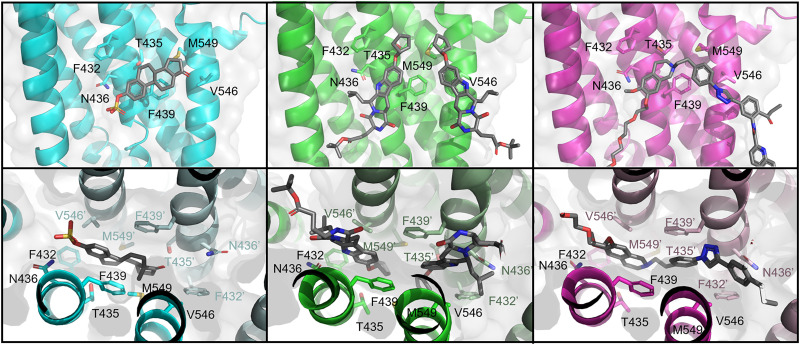
Fig. 6.
Structures of ligand-bound ABCG2. Top panels show cut-away from the binding interface while bottom panels show the view up the binding cavity. Ligands are shown as gray sticks. One monomer is shown in a bright color (TMD) while the second is shown in a pastel shade (TMD’). Left panels: Estrone 3-sulfate-bound ABCG2 (cyan, PDB: 6HCO). Middle panels: MZ29-bound ABCG2 (green, PDB: 6ETI). Right panels: MB136-bound ABCG2 (magenta, PDB: 6FEQ).

