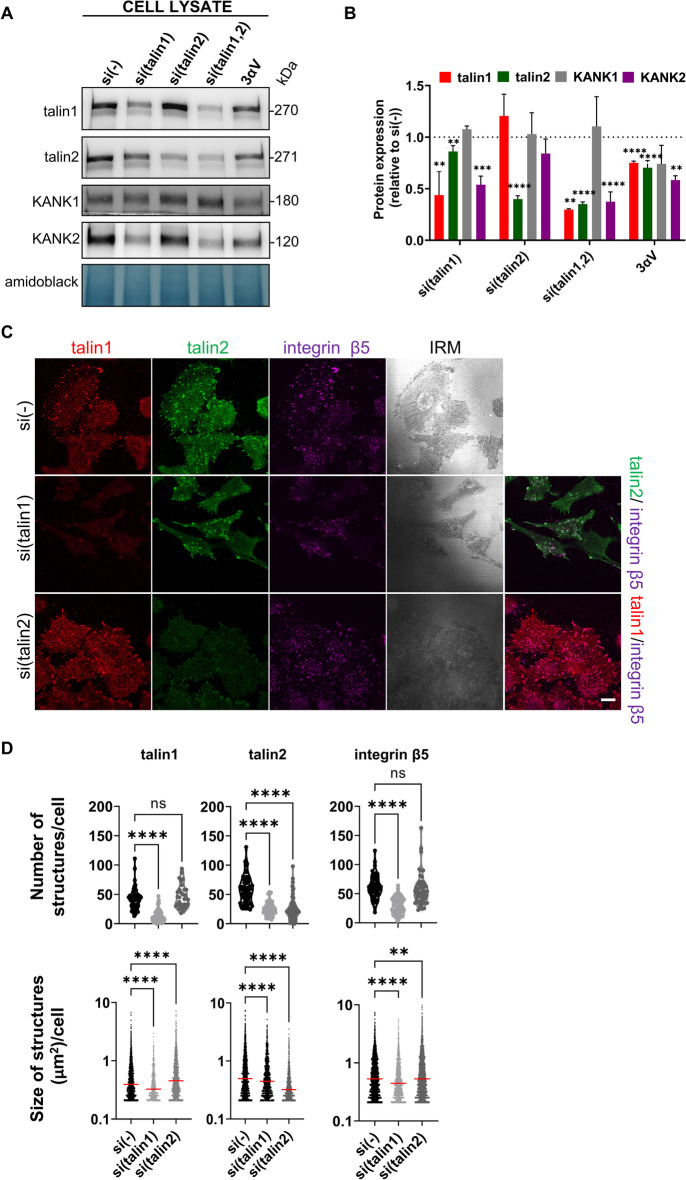
Fig. 2.
Talin1, unlike talin2, is necessary for formation of integrin αVβ5 FAs. A Talin1 knockdown, unlike talin2, reduces the level of KANK2 in whole cell lysates, while KANK1 level does not change upon either talin1 or talin2 knockdown. WB analysis of talin1, talin2, KANK1 or KANK2 in MDA-MB-435S cells transfected with either control, talin1, talin2 or a combination of talin1 and talin2-specific siRNAs and in the 3αV clone with decreased expression of integrin αV. Forty-eight hours after transfection total cell lysates were collected and WB analysis was performed. The results presented are representative of three independent experiments with similar results. B Quantification of data presented in (A). Histogram data are plotted as mean ± SD (n ≥ 3) relative to expression in MDA-MB-435S cells transfected with control siRNA that was set as 1 (indicated by a dotted line). Data were analyzed by one-way ANOVA with Dunnett’s multiple comparison. ns, not significant; * P < 0.05; ** P < 0.01; *** P < 0.001; **** P < 0.0001. C Knockdown of talin1 leads to disruption of αVβ5 FAs. Forty-eight hours after transfection with either control siRNA, talin1 or talin2-specific siRNA, MDA-MB-435S cells were methanol fixed, and stained with anti-talin1 antibody followed by Alexa-Fluor IgG1 555-conjugated antibody (red), anti-talin2 antibody followed by Alexa-Fluor IgG2b 488-conjugated antibody (green) and anti-β5 antibody followed by Alexa-Fluor 647-conjugated antibody (magenta) and IRM images were taken. Analysis was performed using TCS SP8 Leica. Scale bar = 10 µm. D Quantification of data presented in (C). Violin plots (number of structures/cell) and scatter plots with median marked in size (size of structures/cell) represents measurements of > 45 cells. Data were analyzed by one-way ANOVA with Dunnett’s multiple comparison. ns, not significant; * P < 0.05; ** P < 0.01; *** P < 0.001; **** P < 0.0001

