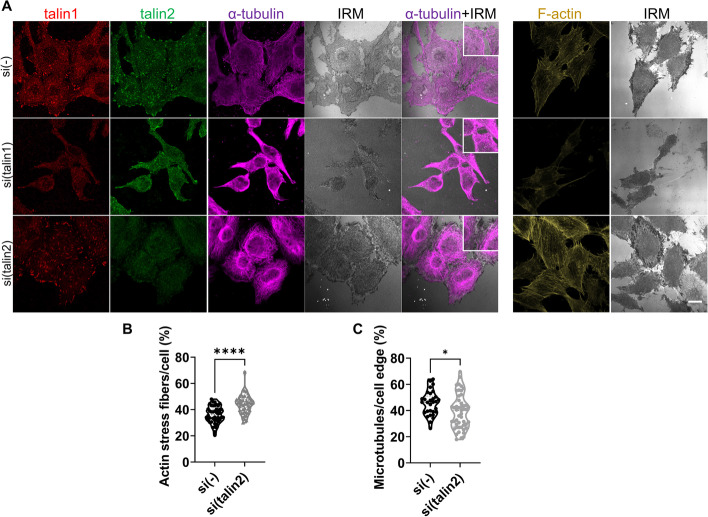
Fig. 4.
Talin1 or talin2 knockdown affects actin and MT cytoskeleton. A Visualization of α-tubulin and F-actin upon knockdown of talin1 or talin2. Forty-eight hours after transfection with either control, talin1 or talin2-specific siRNA, MDA-MB-435S cells were fixed with methanol (for α-tubulin visualization) or PFA followed by permeabilization with Triton X-100 (for F-actin visualization), and stained with anti-talin1 antibody followed by Alexa-Fluor IgG1 555-conjugated antibody (red), anti-talin2 antibody followed by Alexa-Fluor IgG2b 488-conjugated antibody (green), anti-α-tubulin antibody followed by Alexa-Flour 647-conjugated antibody (magenta) and IRM images were taken. For F-actin visualization cells were incubated with Alexa-Flour 488 conjugated phalloidin (shown in gold). Analysis was performed using TCS SP8 Leica. Scale bar = 10 µm. B, C Quantification of data presented in (A). Violin plots represents measurements of > 30 cells. Data were analyzed by unpaired Student’s t-test. ns, not significant; *P < 0.05; **P < 0.01; ***P < 0.001; ****P < 0.0001

